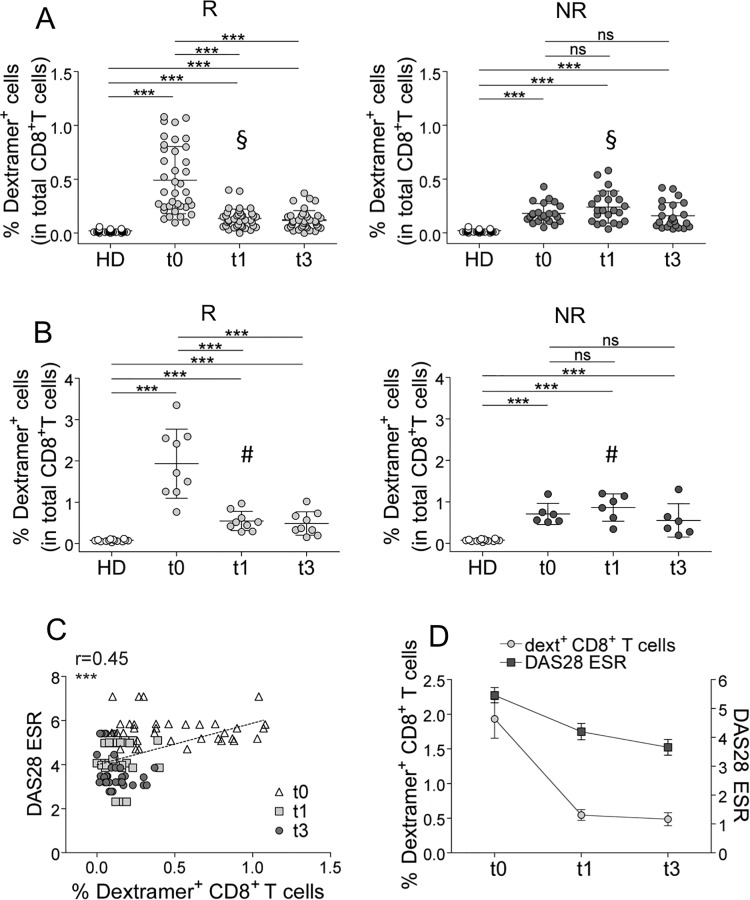
Fig 6. Time course analyses performed longitudinally throughout the follow-up in TNF-α inhibitor-treated patients (A-D).
(A) Percentages of the single AE-specific dextramer+CD8+ T cells determined before (t0) the start of TNF-α inhibitor therapy and after 1 month (t1) and 3 months (t3) from the start of TNF-α inhibitor therapy in Rs and NRs (each symbol represents a single AE-specific dextramer+CD8+ T cell population). Statistical analysis was performed with the Wilcoxon matched pairs test. ***P < 0.0001; ns = not significant. The § symbol indicates the percentages of single AE-specific dextramer+CD8+ T cells that were compared between Rs and NRs at the t1 (**P < 0.001). (B) Sum of percentages of the single-specific dextramer+CD8+ T cells in single R and NR (each symbol represent a single patient). Statistical analysis was performed with the Wilcoxon matched pairs test. ***P < 0.0001; ns = not significant. The # symbol indicates the percentages of single AE-specific dextramer+CD8+ T cells that were compared between Rs and NRs at the t1 (**P < 0.001) (C) Correlation between DAS28-ESR and percentage of AE-specific dextramer+CD8+ T cells in Rs (Spearman correlation analysis). (D) Parallel follow-up of AE-specific dextramer+CD8+ T cell analyses and DAS28-ESR at t0, t1, and t3 from the start of TNF-α inhibitor therapy in Rs.

