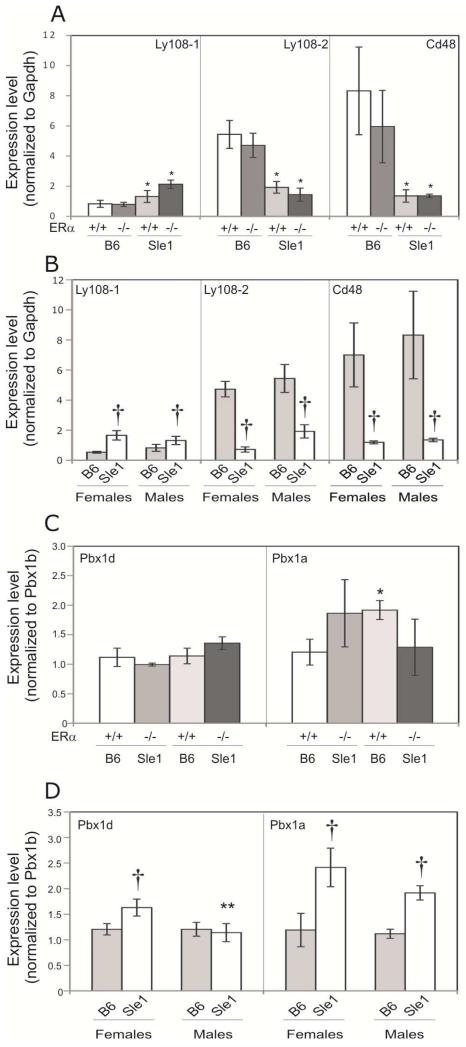
Figure 6. Impact of ERα genotype on the expression of Sle1-associated genes in male mice.
The relative abundance of transcripts produced by genes that underlie Sle1 was assessed using quantitative RT-PCR. Data is presented as mean ± standard error of the mean. The expression of Ly108-1, Ly108-2 and CD48 relative to Gapdh in B cells (A and B) and Pbx1d and Pbx1a relative to Pbx1b in T cells (C and D) is shown. The impact of Sle1 and ERα genotype on the expression of Ly108-1, Ly108-2 and CD48 is shown by comparing relative expression in B6.ERα+/+, B6.ERα−/−, B6.Sle1;ERα+/+ and B6.Sle1;ER−/− males (N=4-5 per genotype) (A). The impact of sex on the expression of Ly108-1, Ly108-2 and CD48 is shown by comparing expression in B6 and B6.Sle1 females and males (B). The impact of Sle1 and ERα genotype on the expression of Pbx1d and Pbx1a is shown by comparing relative expression in B6.ERα+/+, B6.ERα−/−, B6.Sle1;ERα+/+ and B6.Sle1;ERα−/− males (N=4-5 per genotype) (C). The impact of sex on the expression of Pbx1d and Pbx1a is shown by comparing expression in B6 and B6.Sle1 females and males (D). The * indicates a P<0.05 compared to B6 male mice of the same ERα genotype (A and C). The † indicates a P<0.05 compared to sex-matched B6 mice (B and D). The ** indicates a P<0.05 compared to female mice of the same Sle1 genotype (D).

