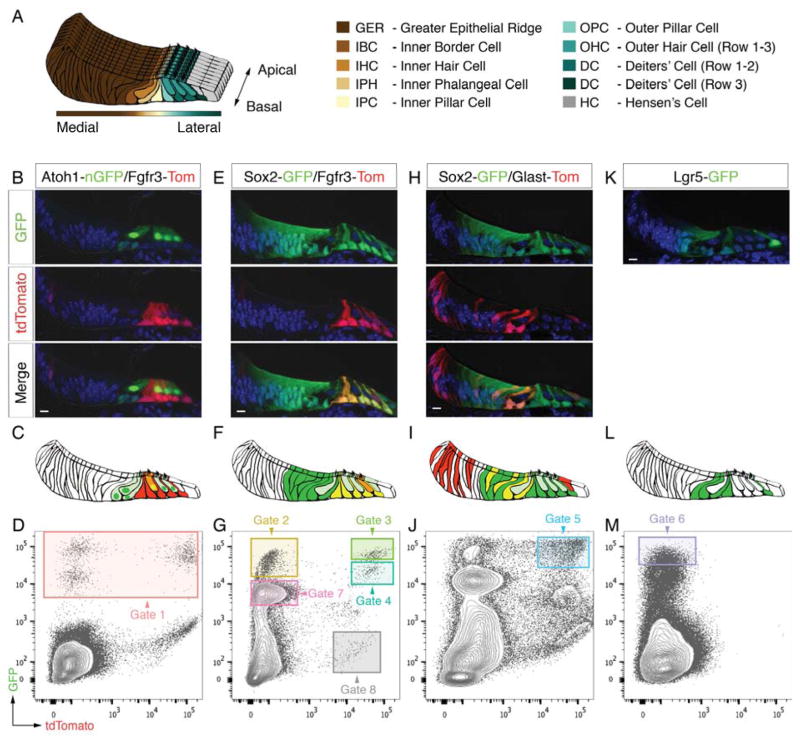
Figure 1.
Sorting of different organ of Corti cell types. (A) Schematic representation of the mouse organ of Corti at P2 and color code used for different cell types. (B, C) Fluorescent reporter gene expression in a representative mid-basal P2 organ of Corti cryo-section of the Atoh1-nGFP/Fgfr3-iCreERT2/Ai14-tdTomato mouse line. (D) FACS plot and gating strategy for isolation of GFP-expressing cells (gate 1). (E-M) Analogous data representation for three additional mouse lines. Scale bars: B,E,H,K, 10μm. Related to Figure S1.

