Figure 6.
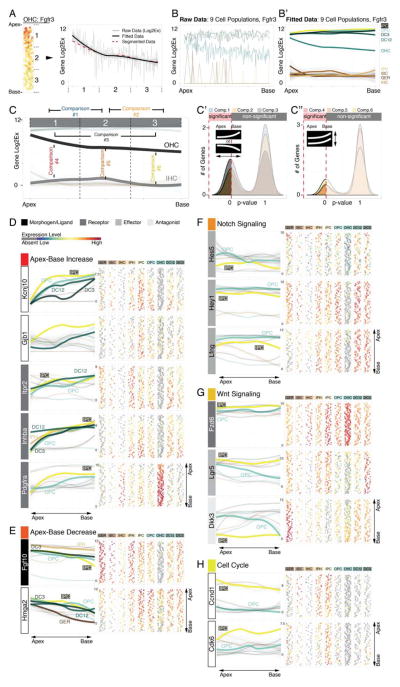
Identification of statistically significant differences to reveal differential gene expression in organ of Corti supporting cells. The procedure is illustrated using Fgfr3 expression as an example. (A) Along the apex-to-base axis the OHC population was divided into three compartments. The plot shows expression data as well as fitted data from apex to base across the three compartments. Compartments’ mean expression values are concurrent with fitted data. (B, B′) Application of this strategy to all 9 cell groups translates the organ of Corti map into a statistical tool, (C-C″) allowing for 2-fold comparisons resolving statistical differences between different compartments along the longitudinal axis of one population (comparisons 1 – 3), or within one compartment between different cell groups (comparisons 4 – 6). (D) Asymmetric gene expression increasing in statistically different manner (comparisons 1–3, *p≤0.05) from the base towards the apex for Kcnj10, Gjb1, Itpr2, Inhba and Pdgfra. (E) Fgf10 and Hmga2 show inversely oriented gradients. (F-H)) Notch effectors (Hes5, Hey1 and Lfng), Wnt-(Lgr5, Fzd6 and Dkk3), and cell cycle genes (Ccnd1 (Cyclin D1) and Cdk6) are differentially expressed (comparison 4, *p≤0.05) between apical inner pillar cells and apical outer pillar cells.

