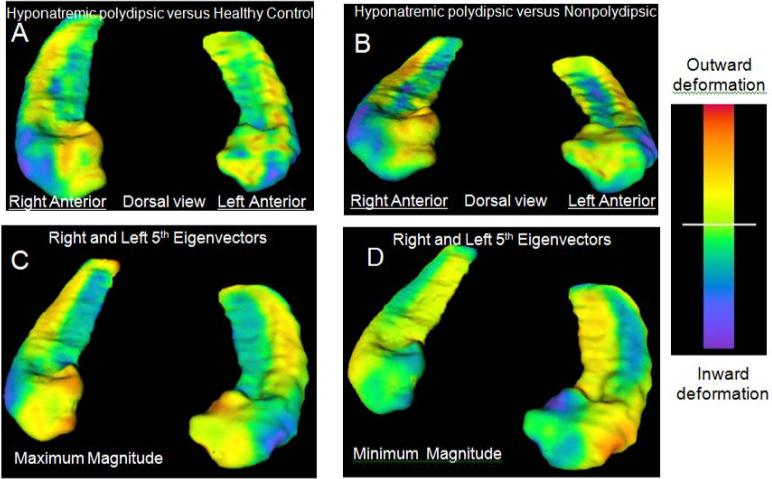
Figure 1.
Hippocampal shape differences. Panel A shows surface map of polydipsic hyponatremic schizophrenic patients (PHS) compared to healthy controls and Panel B is PHS compared to nonpolydipsic patients (NNS). Inward deformations in PHS patients are in blue in Panels A, B, inward deformations in NNS patients are in orange (minimal apparent) in panel B. See Figure 2 for surface map restricted to significant group differences. Panel C shows maximal (illustrative of PHS group) and Panel D shows minimal (illustrative of NNS group) deformations captured by the 5th eigenvector. Note the blue on the anterior lateral surfaces in C overlaps the blue in A, B and in Figure 2 A,B; and that blue on the anterior medial surface in D overlaps the orange in B and in Figure 2B. The range in A,B is 0 to ±3 mm, and in C,D is 0 to ±1 mm.

