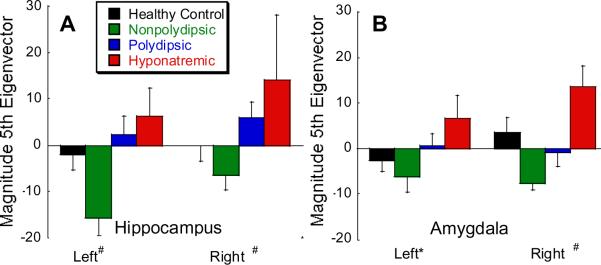
Figure 3.

Amygdala shape differences. Note the minimal shape differences between PHS and HC in Panel A. Red/orange colors in Panel B reflect inward deformations on the anterior surface in NNS relative to PHS. Panel C shows maximal (illustrative of PHS group) and Panel D shows minimal (illustrative of NNS group) deformations captured by the 5th eigenvector. Note the blue on the medial surface in C, D reflecting inward deformations in PHS, and the blue on the anterior and posterior lateral surfaces reflecting inward deformations in NNS.
