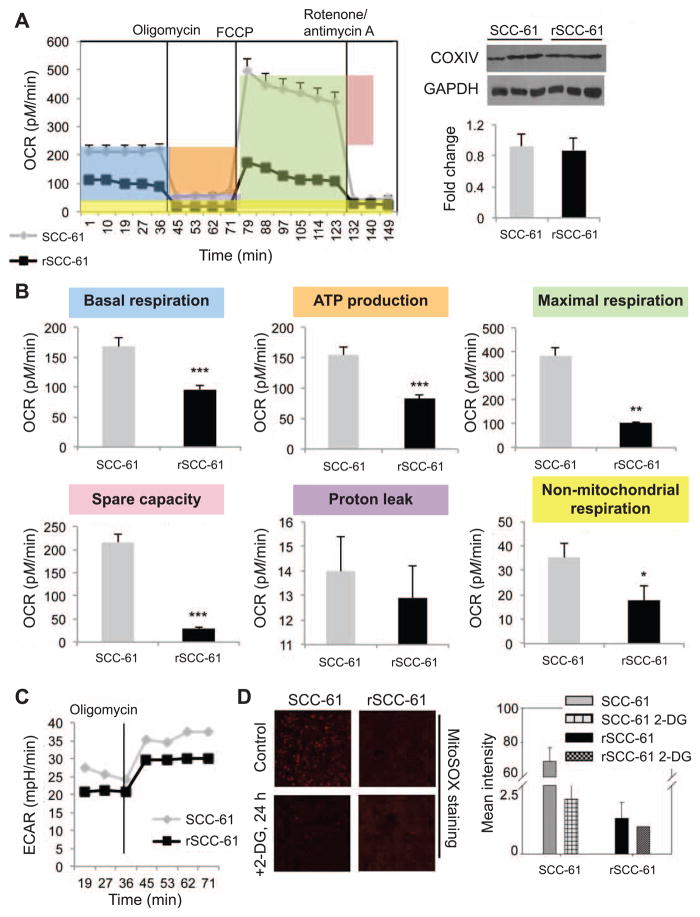
FIG. 4.
rSCC-61 has decreased OXPHOSP capabilities. Panel A: Oxygen consumption rate (OCR) for SCC-61 and rSCC-61 cells using Seahorse XFA 24-3. As shown in the OCR profile plot, the first five measurements represent OCR of untreated cells followed by sequential addition of three mitochondrial inhibitors (after measurements 5, 9 and 15, respectively). Right panel shows the CoxIV Western blot demonstrating equal mitochondrial content in the two cells lines. Panel B: Statistical analysis and representative plots extracted from the study in panel A. The P values are as follows: basal respiration ***P < 0.001; ATP production ***P < 0.001; maximal respiration **P = 0.006; spare capacity ***P < 0.001; and nonmitochondrial respiration *P = 0.03. Panel C: Extracellular acidification rate (ECAR) data showing increased ECAR in SCC-61 (n = 5). Panel D: Imaging analysis of mitochondrial ROS using MitoSOX staining for superoxide in SCC-61 and rSCC-61 cells untreated and treated with 20 mM 2-DG for 24 h.

