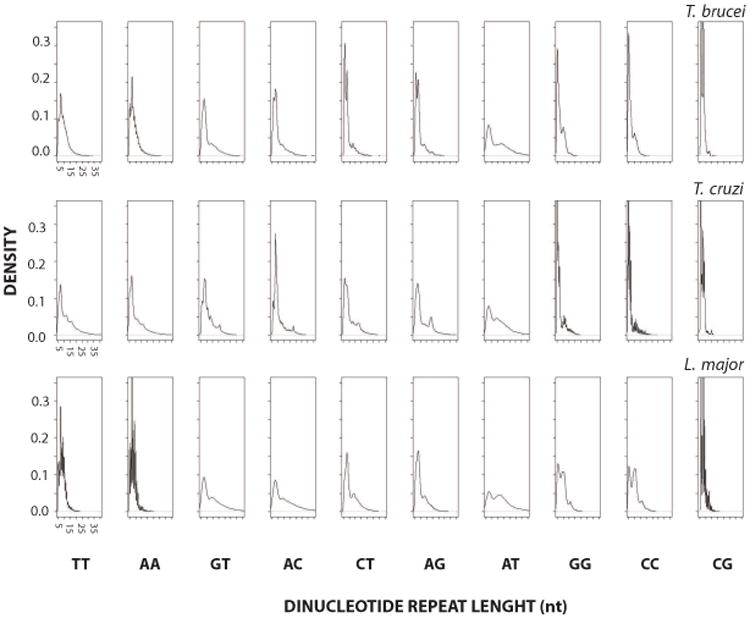
Figure 3. Length density of DRs.

The abundance of DRs in coding strands is shown as a distribution (relative frequency of a dinucleotide for a particular length range). The abscissa plots the length of the repeat (nt) with an arbitrary maximum of 35 nt and the ordinate the relative frequency of repeats for a given length. Axis labels are only shown for the left most panels, being identical in the rest of them within a single species. Species name corresponding to the data is indicated above each panel.
