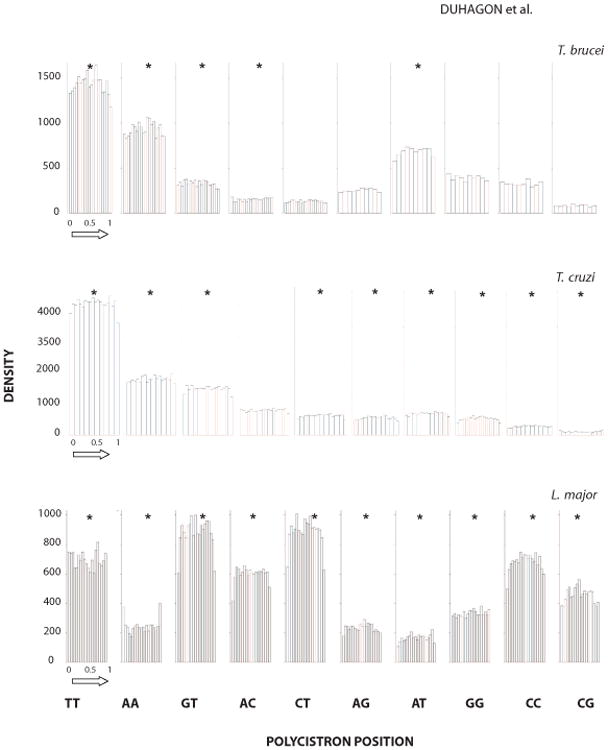
Figure 5. DRs distribution along polycistrons.

The histogram of each class of DR in the sense strand of polycistrons is shown. The relative distance from the strand-switch from head to tail (as indicated by the arrow) is depicted in the abscissa. Rejection of the null hypothesis of uniform distribution by Smirnov-Kolmogorov goodness of fit test (p≤0.0001) is indicated by *. Species name corresponding to the data is indicated above each panel.
