
Figure 6. DR distribution along intergenic regions.
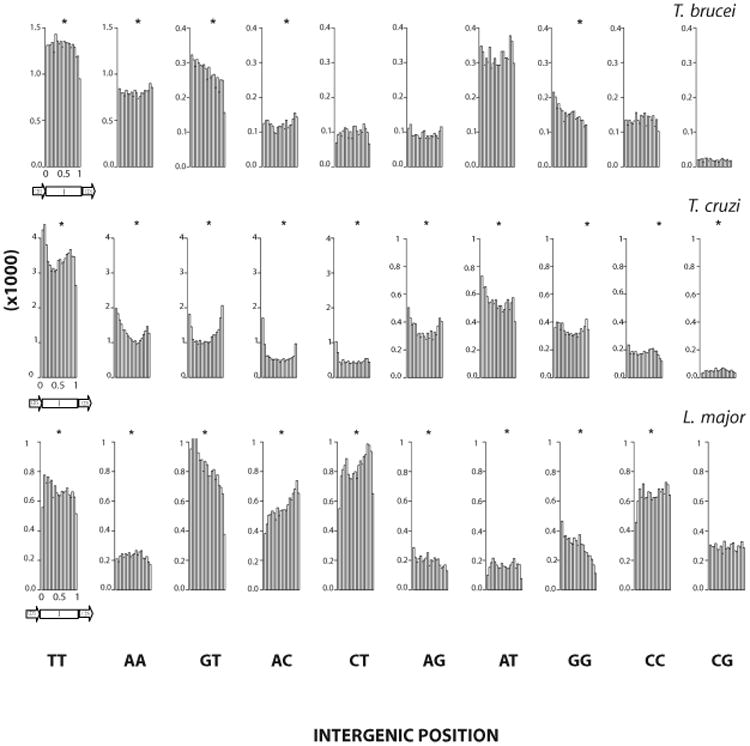
The histogram of each class of DRs in the inter-CDS regions (I) is shown. The relative distance from the 3′ end of one CDS to the 5′ beginning of the following CDS is depicted (and is indicated by the arrow). Rejection of the null hypothesis of uniform distribution by Smirnov-Kolmogorov goodness of fit test (p≤0.0001) is indicated by *. Species name corresponding to the data is indicated above each panel.