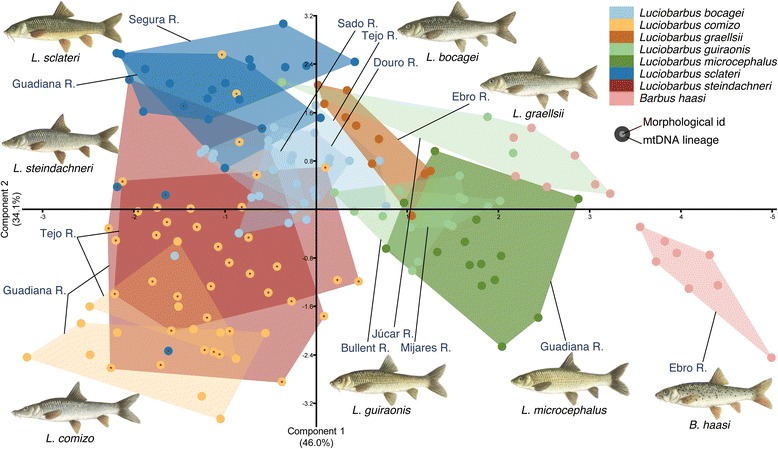
Fig. 2.

Scatterplot of PC1 and PC2 of meristic traits of all endemic Iberian Barbus and Luciobarbus species. Center of symbol represents morphological identification of specimens following Almaça [21], perimeter of each symbol represents mtDNA lineage defined in Fig. 3. Polygon delimits samples from each population/species
