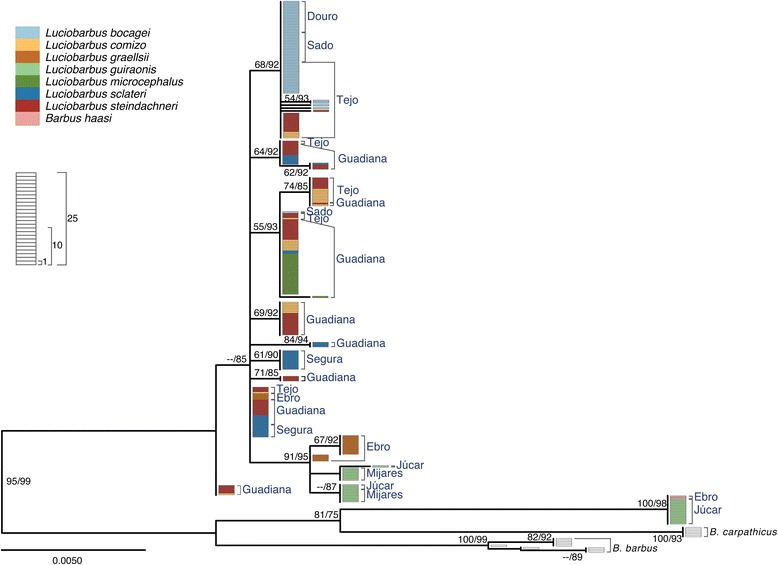
Fig. 6.

Maximum likelihood phylogeny of Gh-1 alleles. Bootstrap and Approximate Likelihood Ratio Test support values (left/right, respectively) are given next to relevant nodes. Each rectangle represents one allele. Colors represent morphological identification of specimens following Almaça [21]
