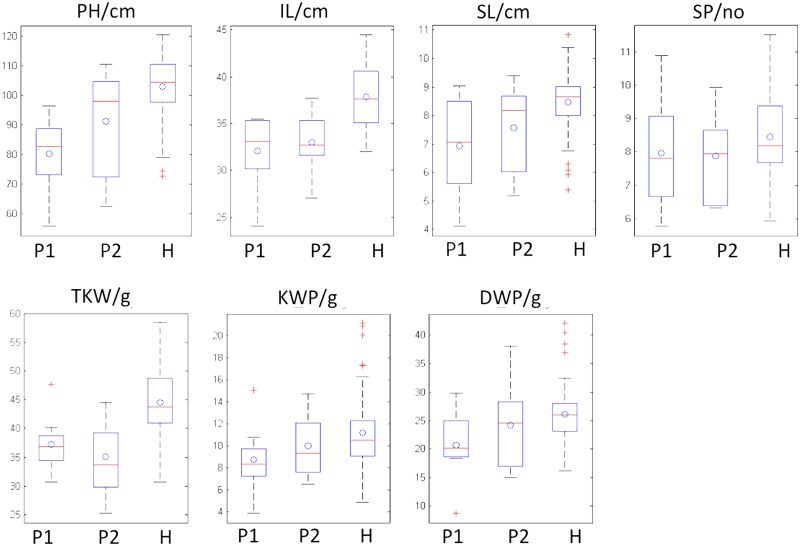
Fig 1. Box plots for performances of parents and crosses for seven measured traits.
P1: female parents; P2: male parents; H: hybrids. The circle ‘o’ stands for mean value. The plus sign ‘+’ stands for outliers. The upper and lower lines outside the box stand for max and min adjacent value, respectively. The line inside the box stands for median value. The upper and lower hinge of the box stand for 75% and 25% percentile, respectively.

