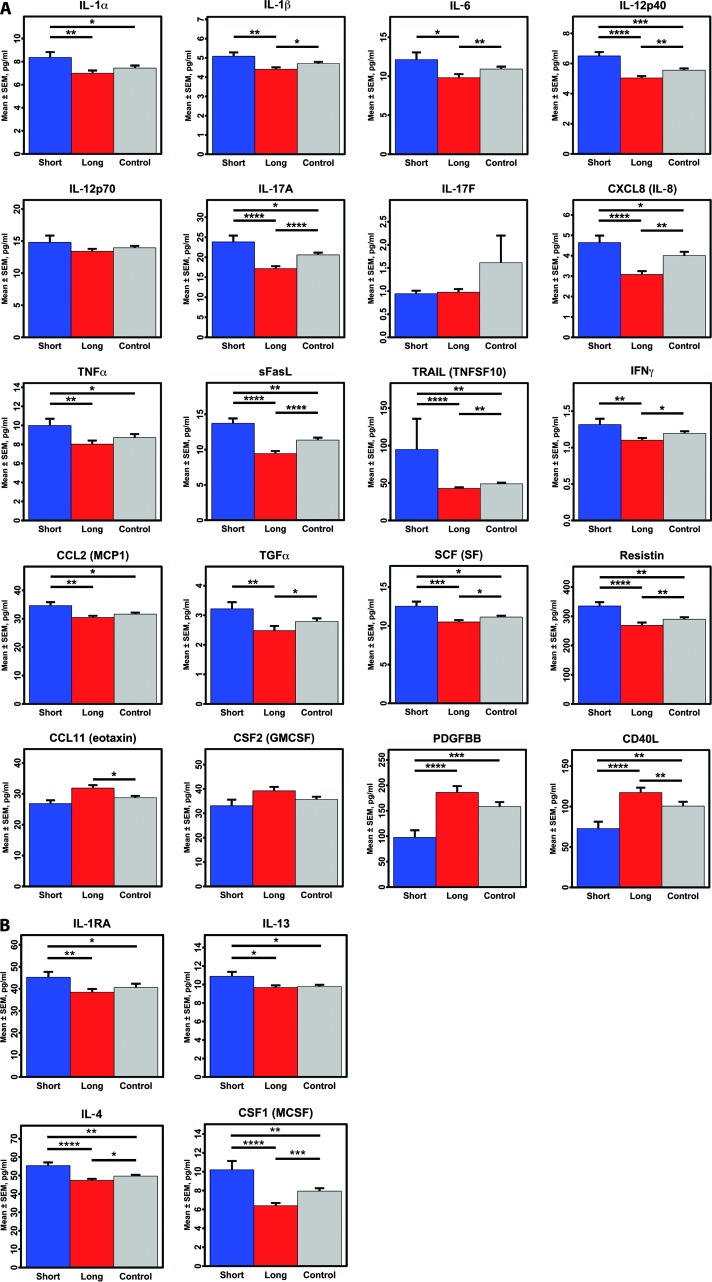
Fig. 1. Comparison of plasma cytokine levels in short-duration ME/CFS, long-duration ME/CFS, and control subjects.
(A) Proinflammatory cytokines. (B) Anti-inflammatory cytokines. The means ± SEM for each cytokine are shown. Only cytokines meeting significance criteria (P < 0.05) in either the one-way or the two-way GLM are represented. *P < 0.05, **P < 0.01, ***P < 0.001, ****P < 0.0001 by two-sample t-test comparisons.

