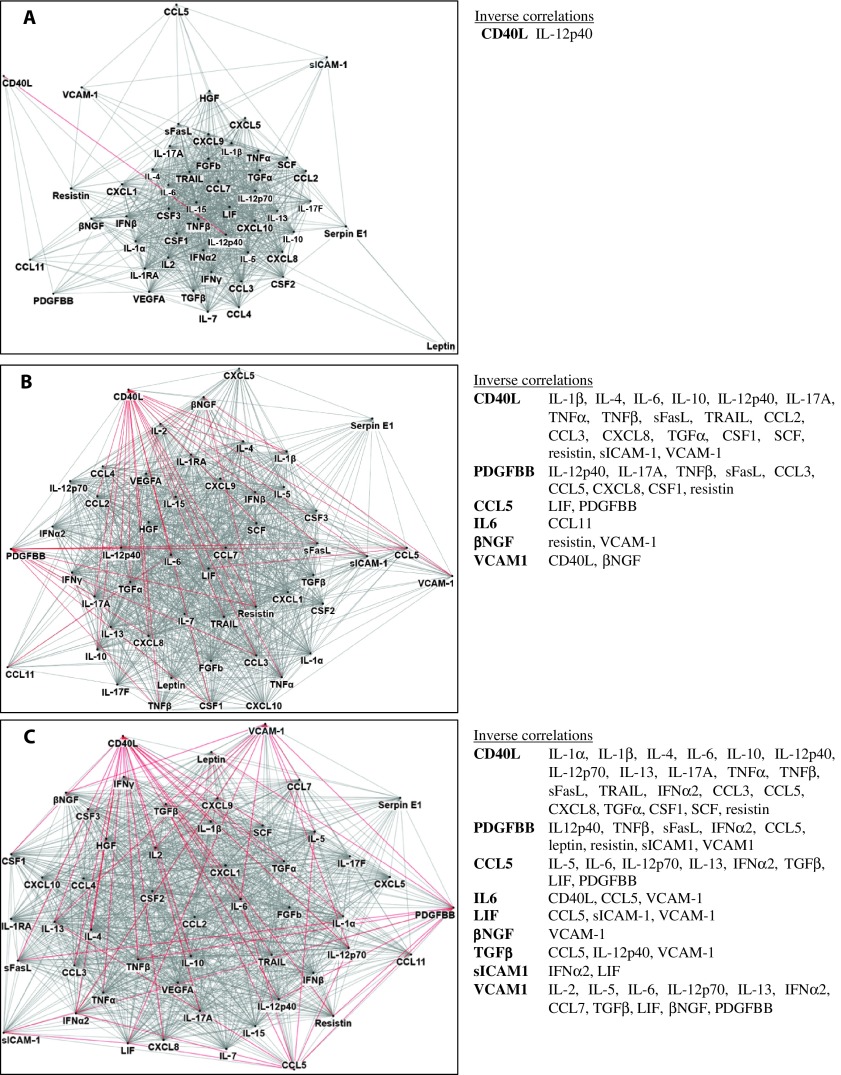
Fig. 2. Network cytokine-cytokine associations differ for short-duration versus long-duration ME/CFS versus control subjects.
(A to C) Network diagrams for short-duration ME/CFS subjects (A, n = 52), long-duration ME/CFS subjects (B, n = 246), and healthy controls (C, n = 348). Network diagrams of the 51 measured cytokines were created in NodeXL (http://nodexl.codeplex.com) using a 0.01 family-wise false discovery rate (FDR) to adjust for multiple comparisons (A, short-duration group, P = 0.0065; B, long-duration group, P = 0.0081; C, control group, P = 0.0075). Red lines (edges) indicate negative correlations, and gray lines indicate positive cytokine-cytokine correlations with associated P values that fall below the corrected P value criterion for each group. Note that whereas CD40L drives most of the inverse relationships with other immune molecules in both the long-duration ME/CFS and the control groups, CD40L is only related to five other cytokines in the short-duration ME/CFS group, and only one of these associations is negative (inverse relationship with IL-12p40). Similarly, PDGFBB is a negative driver of many other cytokines in both long-duration ME/CFS and control subjects, but shows no negative correlations with other cytokines in the short-duration subset.

