
Figure 4.
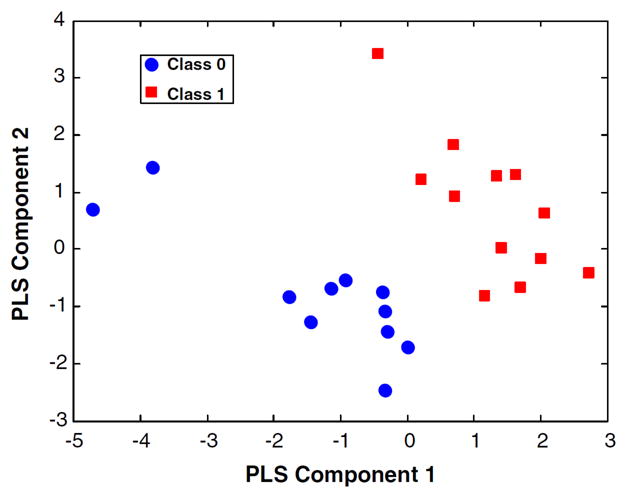
Scores from the PLS-DA discrimination of 1H NMR spectra from 23 healthy volunteers, where class labels have been randomly assigned. Internal cross-validation produces a Q2 of -0.18, clearly well below acceptable limits. Nevertheless, the scores plot displays a clear separation between classes that could lead the inexperienced practitioner to wholly false biological conclusions. Reprinted with permission from reference [88], (Copyright 2008 Westerhuis et. al.).