
Figure 7.
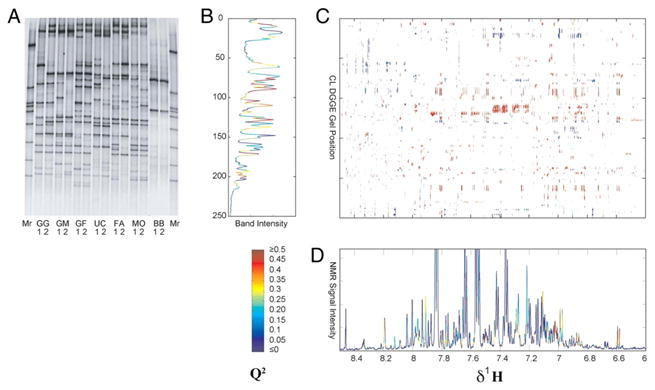
Cross-correlation analysis between the DGGE gel in (A) and collected 1H NMR spectra of urine metabolites. (B) Prediction of DGGE bands using NMR spectra. (C) Correlation matrix relating the aromatic region of collected NMR spectra to DGGE bands. Red indicates positive correlation greater than 0.7 and blue indicates negative correlation of the same magnitude or greater. (D) Prediction of the NMR spectral aromatic region based on DGGE data. Both predictions from OPLS regression are colored according to Q2 obtained from cross-validation. Reprinted with permission from reference [45], (Copyright 2008 National Academy of Sciences of the USA).