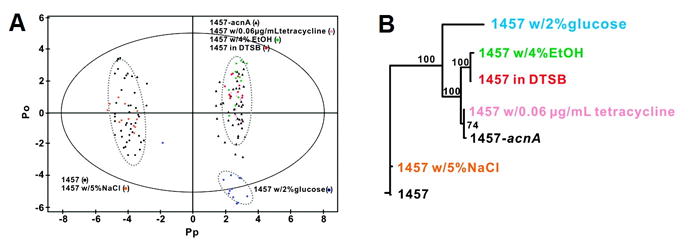
Figure 8.

Results of OPLS-DA modeling of the metabolomic effects of six different stressors on S. epidermidis. (A) OPLS scores of all experimental groups, showing the high observation counts for each group necessary for statistical treatment of scores. Ellipses around each group the 95% confidence regions of the groups under the assumption of normally distributed data. (B) Dendrogram built from OPLS scores-space data using Euclidean distances between the sample means of each group. Within-group substructure that was not forced during class discrimination is evident in the dendrogram. Group name colors in (B) correspond to scores colors in (A). Reprinted with permission from reference [116], (Copyright 2011 American Chemical Society).
