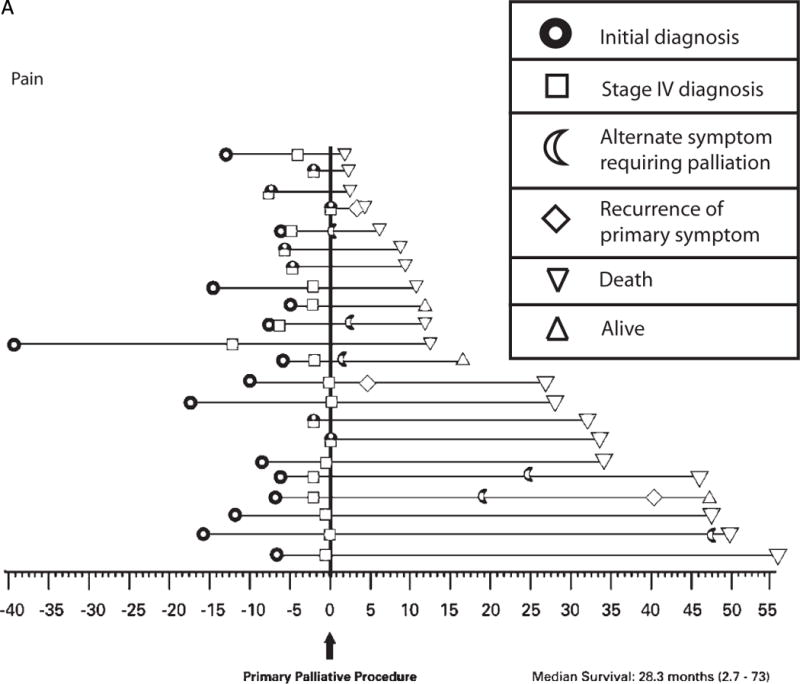
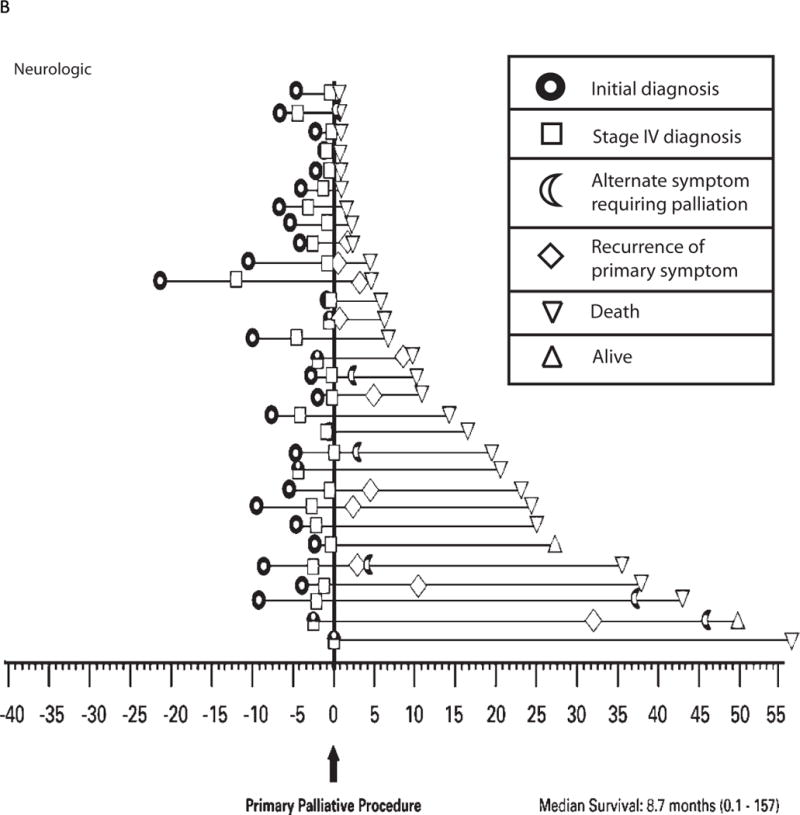
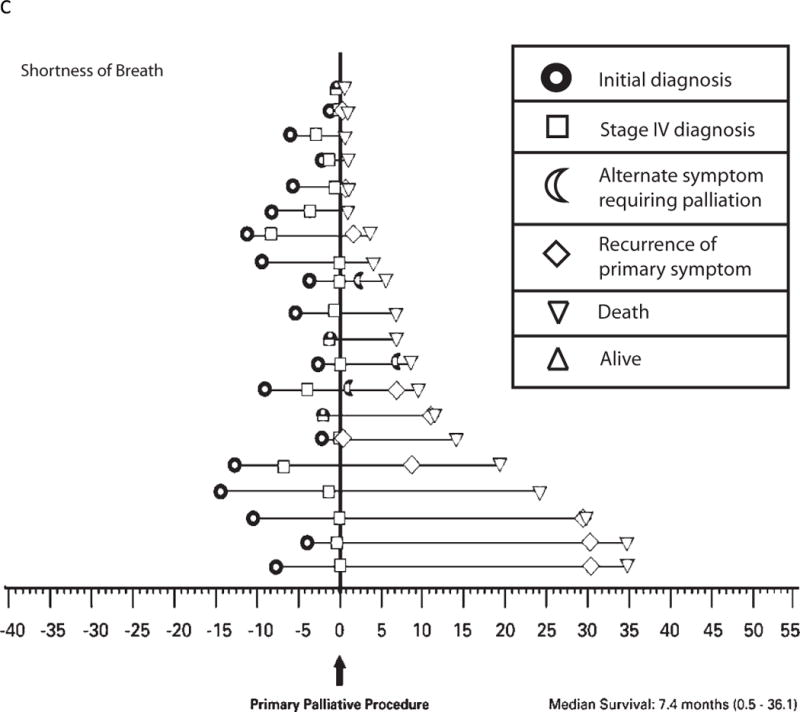
Figure 2.


a: Time-course of disease progression and the need for palliative intervention as captured by this study for individual patients presenting with pain. Each horizontal line on the graph represents a single patient (n = 22). Time point “0” represents the first palliative procedure at study entry, and subsequent events are noted along the time course of their disease as denoted in the figure legend. Two of these 22 patients underwent a palliative procedure for pain prior to the time period selected for this study.
b: Time-course of disease progression and the need for palliative intervention as captured by this study for individual patients presenting with neurologic symptoms. Each horizontal line on the graph represents a single patient (n = 30). Time point “0” represents the first palliative procedure at study entry, and subsequent events are noted along the time course of their disease as denoted in the figure legend. Seven of these 30 patients underwent a palliative procedure prior to the time period selected for this study, 2/7 prior palliative procedures were also performed for neurologic symptoms.
c: Time-course of disease progression and the need for palliative intervention as captured by this study for individual patients presenting with shortness of breath. Each horizontal line on the graph represents a single patient (n = 20). Time point “0” represents the first palliative procedure at study entry, and subsequent events are noted along the time course of their disease as denoted in the figure legend. Two of these 20 patients underwent a palliative procedure for unrelated symptoms prior to the time period selected for this study
