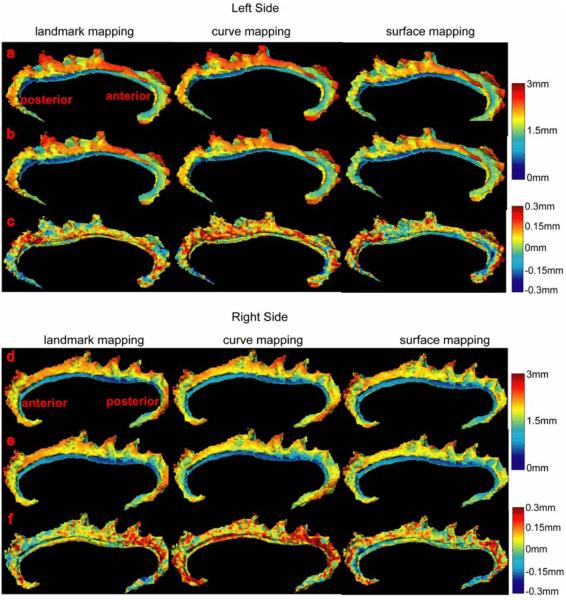
Figure 6.
Rows (a-b) show the average thickness maps of the left cingulate in the control (row (a)) and schizophrenic (row (b)) groups. The average group difference in thickness of the left cingulate is shown in row (c). Similarly, rows (d-e) show average thickness maps of the right cingulate in the control (row (d)) and schizophrenic (row (e)) groups. The average group difference in thickness of the right cingulate is shown in row (f). From the left to the right columns, the average thickness maps were generated via the landmark, curve, and surface mappings, respectively.

