
Figure 3.
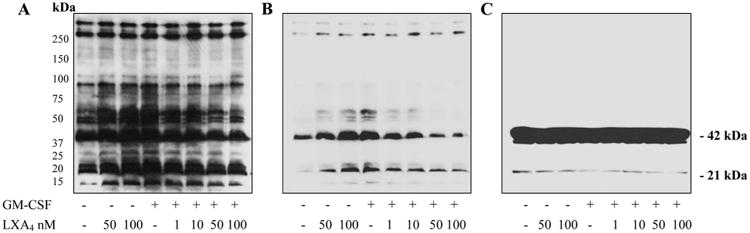
1DE/LDS-PAGE Western blot analyses of EoL-1 cell lysates from overnight starved cells pretreated for 30 min with increasing concentrations of LXA4 as shown followed by stimulation with GM-CSF (10 ng/ml, 10 min). A, Visualization of protein bands containing phosphotyrosine. Immunoblot analysis with anti-phosphotyrosine staining. B, Western blot run under the same conditions as in A but with decreased total protein loading for better visualization of intensely stained bands. C, Immunoblot was visualized with anti-actin after stripping the anti-pTyr blot shown in A.