
Figure 5. Effect of acetylation on TDG interaction with SIRT1.
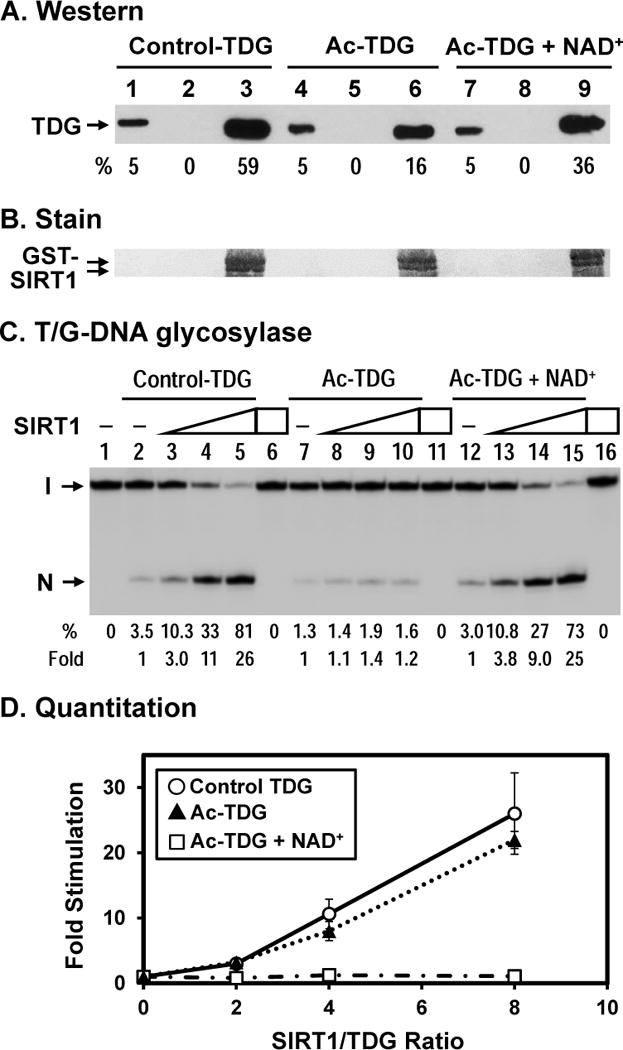
(A) Acetylated TDG has a reduced physical interaction with hSIRT1. hTDG was acetylated in vitro by p300 (lanes 4–9) and control TDG was treated similarly but without acetyl-CoA (lanes 1–3). GST alone (lanes 2, 5, and 8) and GST-hSIRT1 (lanes 3, 6, and 9) were immobilized on glutathione-sepharose and incubated with 100 ng TDG in buffer S (50 mM Tris–HCl, pH 8.0, 150 mM NaCl, and 4 mM MgCl2). Lane 1, 10 ng His-tagged TDG (5% of input), lane 2, unacetylated control TDG bound to GST alone, and lane 3, control TDG bound to GST-SIRT1-FL immobilized on beads. Lanes 4–6 are similar to lanes 1–3 except using in vitro acetylated TDG. Lanes 7–9 are similar to lanes 4–6 except adding 3 mM NAD+ in the incubation buffer. Western blot was detected by TDG primary antibody made in our laboratory and anti-rabbit IgG DyLight 800 (Thermo Scientific) secondary antibody. The image was detected by Typhoon FLA9500 and quantitated by ImageQuant software (GE Healthcare). Percentage (%) of input TDG (lanes 1, 4, and 7) and precipitated TDG as compared to input TDG and adjusted with GST-SIRT1 amounts on membrane in (B) are shown below each lane. (B) The GST-SIRT1 immobilized on membrane of (A) was stained by Ponceau S. As indicated, the amounts of GST-SIRT1 are about the same. (C) SIRT1 has a reduced stimulation on acetylated TDG with T/G-DNA. Control hTDG and acetylated TDG were the same used in (A). 0.18 nM T/G-DNA was incubated with 10 nM TDG in reaction buffer (50 mM Tris-HCl, pH 8.0, 1 mM DTT, 50 μg/ml BSA, 37.5 mM NaCl, 0.75 mM KCl, 1 mM MgCl2) in the absence or presence of SIRT1 or 3 mM NAD+. Lanes 1, DNA alone, Lane 2, 0.18 nM T/G-containing DNA substrate was incubated with 10 nM control hTDG Lanes 3–5 are similar to lane 2 but with added 20, 40, and 80 nM hSIRT1-FL, respectively. Lane 6, T/G-DNA was incubated with 80 nM hSIRT1-FL without TDG. Lanes 7–10 are similar to lanes 2–5 except using Ac-TDG. Lanes 12–15 are similar to lanes 7–10 except adding 3 mM NAD+. Percentage (%) of product generated and fold of stimulation of hSIRT1-FL on the hTDG glycosylase activity from three experiments are shown below each lane. (C) Quantitative analyses of the fold of stimulation of hSIRT1-FL on the TDG glycosylase activity on T/G-DNA substrate from three experiments. Open circles, control TDG; closed triangles, Ac-TDG in the absence of NAD+; and open rectangulars, Ac-TDG in the presence of NAD+. The error bars reported are the standard deviations of the averages.