
Figure 7. TDG is overexpressed in sirt1 knockout cells.
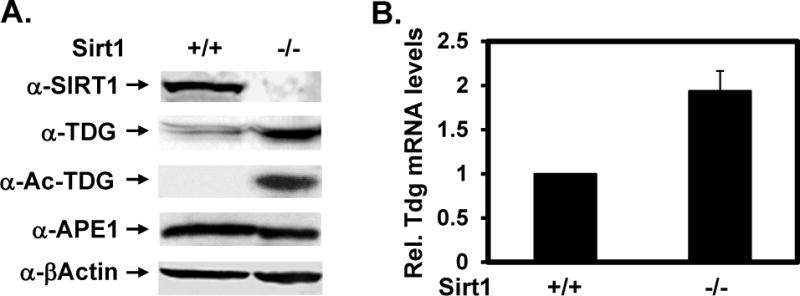
(A) Protein expression levels in wild-type (+/+) and sirt1 knockout (−/−) MEFs. Western blotting was performed with antibodies against SIRT1, TDG, Ac-TDG, APE1, and β-actin in total cell extracts. The TDG protein levels were normalized to the amounts of β-actin. (B) The Tdg mRNA levels in wild-type (+/+) and sirt1 knockout (−/−) MEFs. The mRNA levels were measured by RT-qPCR analysis. The mRNA level of Tdg was calculated relative to that of β-actin as described in Supplementary Materials. The relative Tdg mRNA levels of WT cells over sirt1 KO cells are presented in X-axis. The reactions were carried out in duplicate and data are averaged from three independent experiments.