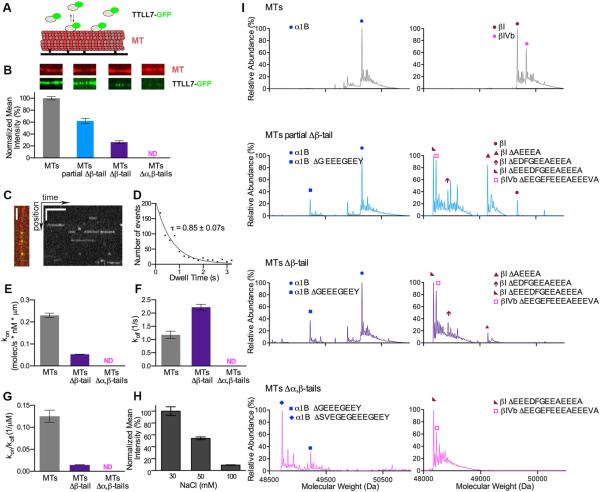
Figure 3. Contribution of tubulin C-terminal tails to TTLL7 microtubule binding.
(A) Schematic of the microtubule-binding assay. Surface immobilized microtubules and GFP-tagged TTLL7 were imaged by TIRF microscopy.
(B) GFP-tagged TTLL7 was incubated with microtubules (MTs), microtubules missing ~30% of their β-tubulin tails (MTs partial Δβ-tail), microtubules missing all their β-tubulin tails (MTs Δβ-tail) and microtubules missing both α- and β-tubulin tails (MTs Δα,β-tails) in the presence of 1 mM ATP. TTLL7 normalized fluorescence intensity ± S.E.M. is shown (N = 45, 49, 44 microtubules for MTs, MTs partial Δβ-tail and MTs Δβ-tail, respectively). Representative microtubules and the corresponding TTLL7 channel are shown. The width of the panels corresponds to 6 µm. Mass spectra for the various microtubules are in (I).
(C) Single-molecule fluorescence analysis. Taxol-stabilized microtubules decorated with single TTLL7-GFP molecules (left) and corresponding kymograph (right). Scale bars, horizontal, 5 s; vertical, 2 μm.
(D) Distribution of durations of TTLL7-GFP interactions with the microtubule. A single-exponential fit to the histogram (corrected for photobleaching) yields a mean lifetime of interaction (τ) of 0.85 ± 0.07s (R2 = 0.9528, N = 807)
(E - G) kon (E), koff (F) and Ka (G) of TTLL7 with various types of microtubules. Error bars indicate S.E.M. N=807 for MTs and N=790 for MTs Δβ-tails obtained from four flow cells imaged on different days (Extended Experimental Procedures).
(H) TTLL7 binding to microtubules at various ionic strengths.
(I) Mass spectra of the types of microtubules used in assays shown in (B) – (G). See also Figure S3.

