Fig. 5.

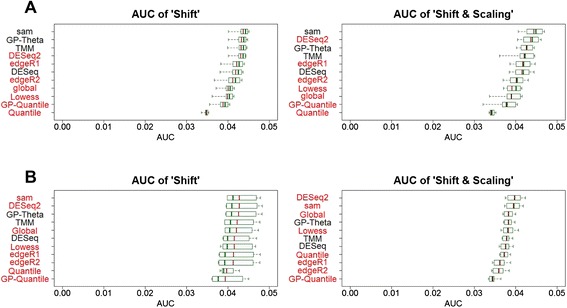
Sensitivity and specificity. a miRNA and b mRNA. The AUC with false positive rate less than 0.05 was calculated. Boxplots summarize AUC values from a wide range of simulation settings. TPR, true positive rate; FPR, false positive rate

Sensitivity and specificity. a miRNA and b mRNA. The AUC with false positive rate less than 0.05 was calculated. Boxplots summarize AUC values from a wide range of simulation settings. TPR, true positive rate; FPR, false positive rate