Fig. 7.

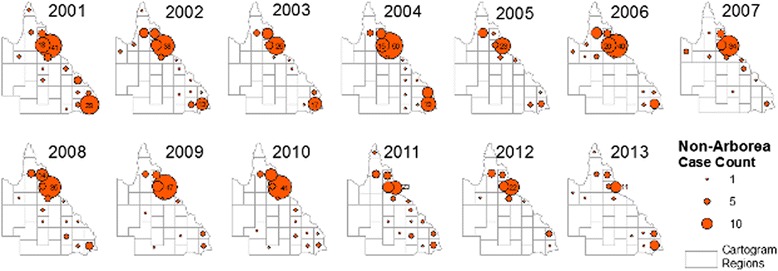
Annual reported cases attributed to non-Arborea serovars in Queensland, 2001 to 2013. Proportional symbols represent the number of cases reported per cartogram region

Annual reported cases attributed to non-Arborea serovars in Queensland, 2001 to 2013. Proportional symbols represent the number of cases reported per cartogram region