Figure 2.
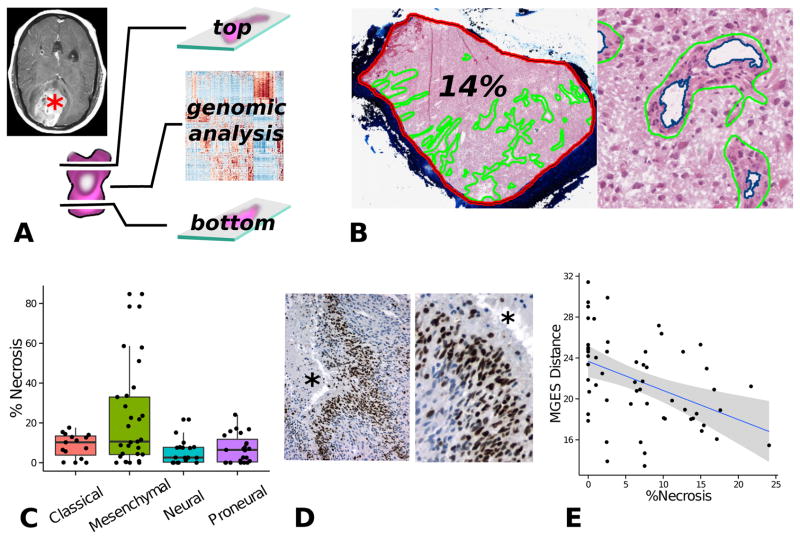
Tumor microenvironment study integrating histology and genomics from TCGA. (A) TCGA specimens are sections from the top and bottom to produce slides, and the middle portion is submitted for genomic analysis. (B) Digitized images from top/bottom sections were annotated to calculate the percentage of necrosis and angiogenesis for each tumor. (C) Tumors from the mesenchymal expression class are significantly enriched with necrosis. (D) As the amount of necrosis increases in non-mesenchymal GBMs, gene expressions patterns shift towards a mesenchymal expression signature.

