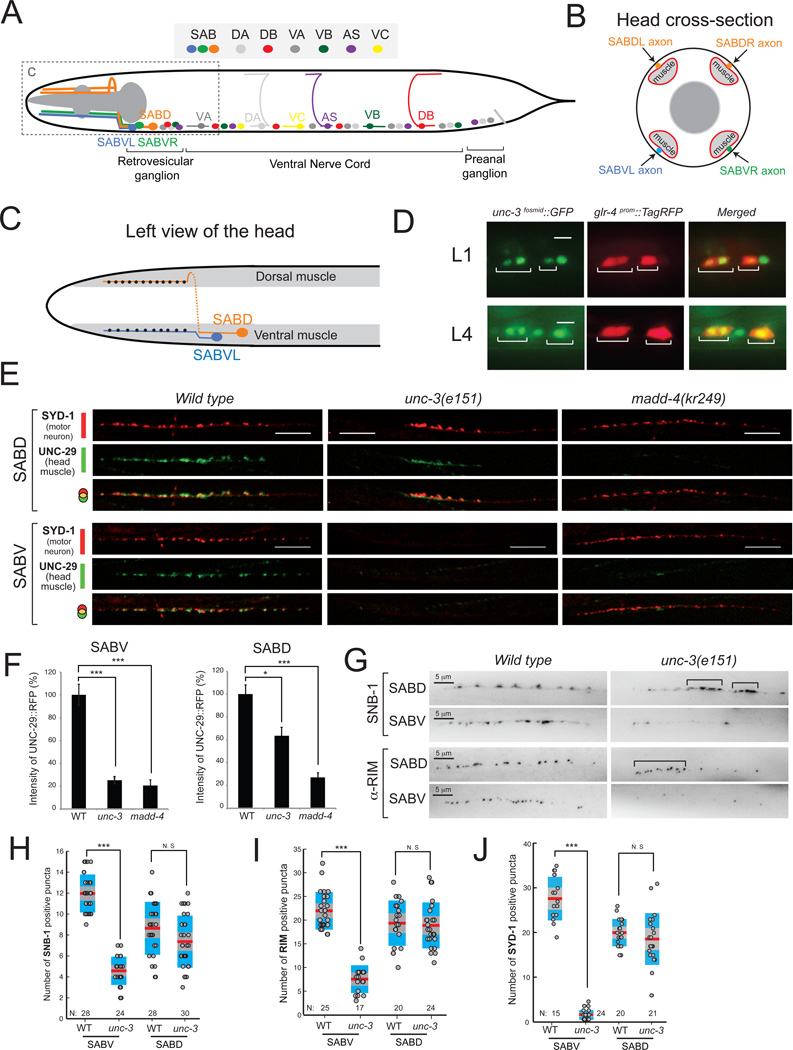
Figure 2. unc-3 controls SAB motor neuron synapse formation.
A: Schematic of SAB and other classes of cholinergic MNs (DA, DB, VA, VB, AS, VC) in C.elegans.
B: Diagram of a cross section of the head showing SAB axons (orange, blue, green), head muscle (light grey), and pharyngeal muscle (dark grey).
C: Left view of the head showing the synapses (black dots) of SABVL onto ventral muscle and the synapses (black dots) of left axon of SABD onto dorsal muscle. Anterior is left.
D: unc-3 is expressed in SAB neurons during larval (L1 and L4) stages. The transgene otIs476[glr-4prom::TagRFP] was used as a marker of SAB neurons. unc-3 expression was monitored using a fosmid-based gfp reporter. Expression of unc-3 was also detected in SABV and SABD neurons during adult stages (data not shown). Scale bar 5 µm. N > 10.
E: Synaptic defects at the SAB innervation zones of unc-3(e151) and madd-4(kr249) mutants. In wild-type (WT) SABD synapses, the presynaptic zone marker SYD-1 is juxtaposed to the AChR marker (UNC-29) expressed in head muscle (20/20 animals examined). In unc-3(e151) mutants, the SABD presynaptic zones are formed but are abnormally clustered as evident by SYD-1 fluorescence. Using SYD-1::GFP as a marker, we observe enlarged, abnormally clustered presynaptic zones in 11/20 (55%) SABD axons in unc-3 mutants compared to 1/20 (5%) SABD axons in WT animals. In the SABV of unc-3(e151) mutants, we barely observe any SYD-1 puncta (20/20 animals). Detailed quantification of SYD-1 positive puncta is provided in J. Post-synaptic clustering of AChR (UNC-29::RFP) is significantly reduced in the SABD and never observed in the SABV neurons of unc-3(e151) mutants (20/20 animals examined). The clustering of AChR in madd-4(kr249) mutants is dramatically reduced in SAB synapses, while the presynaptic zones (labeled by SYD-1::GFP) are normally generated (20/20 animals examined). The line of faint small AChR clusters in SABV of unc-3 and madd-4 mutants corresponds to the boundary of muscle cells (not the SABV innervation zone), which often contains a small amount of extra-synaptic AChRs. As expected, this boundary of muscle cells is also evident in the WT SABV image. For optimal contrast SYD-1::GFP is depicted in red and UNC-29::RFP is in green. Scale bar 10 µm.
F: The degree of L-AChR clustering at the SABV and SABD innervation zones was evaluated by measuring UNC-29::RFP fluorescent intensity. The percentage (%) of fluorescent intensity of UNC-29::RFP intensity was calculated along 55 µm of the SAB innervation zone as previously described in [13]. Error bars show standard error of the mean (sem). We ran a Kruskall-Wallis nonparametric test followed by a Dunn's post test. * = P < 0.05, *** = P < 0.001. SABV: WT (N=16), unc-3 (N=32), madd-4 (N=21); SABD, WT (N=9), unc-3 (N=22), madd-4 (N=15).
G: Visualization of presynaptic boutons using a translational yfp reporter for synaptobrevin-1 (snb-1). A representative image of the boutons along the SABDL and SABVL axons are shown (left view) in WT and unc-3(e151) mutants. Presynaptic boutons often cluster abnormally in the SABD of unc-3 mutants (indicated by brackets), while their number appears normal when compared to WT SABD. Using SNB-1::YFP as a marker, we observe enlarged, abnormally clustered presynaptic zones in 15/24 (62%) SABD axons in unc-3 mutants compared to 3/20 (15%) SABD axons in WT animals. In SABV of unc-3 (e151) mutants, the number of boutons is significantly reduced. Animals at the fourth larval (L4) stage were analyzed. Detailed quantification of SNB-1 positive boutons is provided in H. Visualization of SAB active zones using an antibody for RIM protein. In SABD of unc-3(e151) mutants, the distribution of active zones is abnormal as they often miscluster (indicated by brackets). However, the total number of active zones is not significantly reduced in the SABD of unc-3(e151) mutants. There is a significant reduction of active zones in the SABV of unc-3(e151) mutants. Quantification of RIM staining is provided in I. Scale bar 5 µm. Animals at the first day of adulthood were analyzed. Each dot represents the number of SNB-1 or RIM positive puncta along one SABD or SABV axon. *** : p value < 0.001. N.S, not statistically significant. N = number of axons analyzed. Mean values are represented with a horizontal red line.

