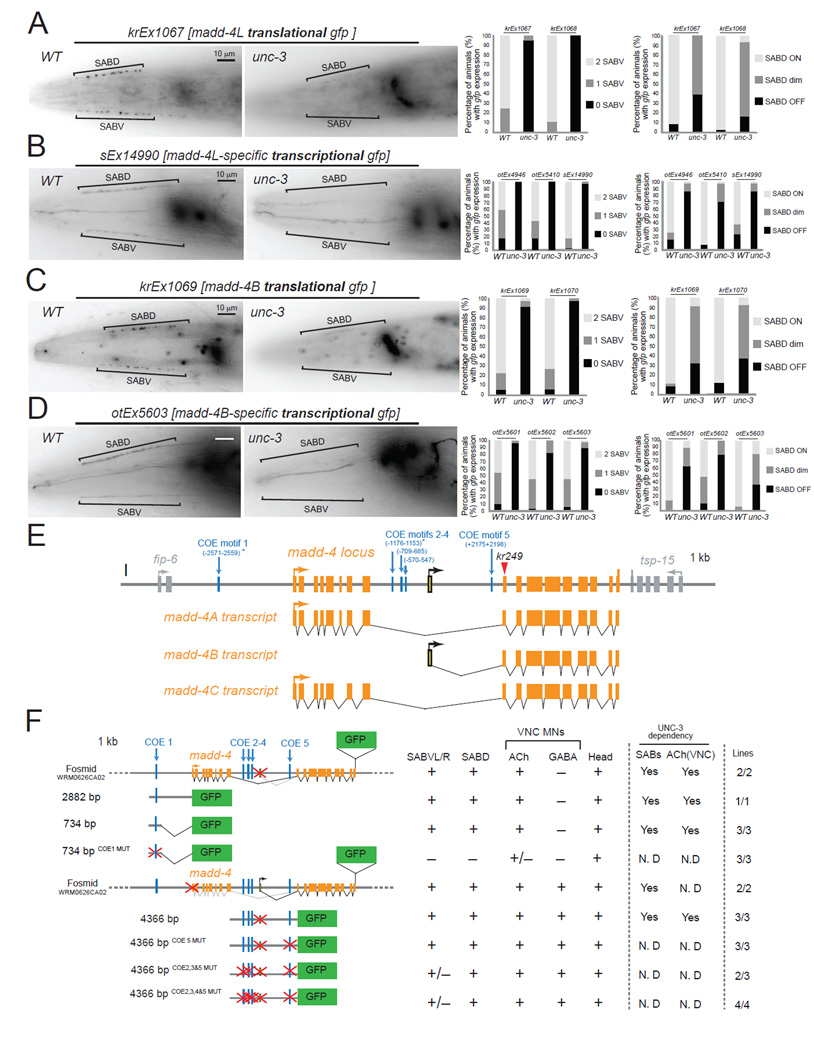
Figure 3. unc-3 controls madd-4 expression.
A: The protein expression of madd-4L is significantly affected in the SAB neurons of unc-3(e151) mutants. Results for two independent extra-chromosomal arrays (kr1067 and kr1068 are madd-4L translational fusions) are quantified on the right. Scale bar 10 µm. N = 20 for krEx1067 in WT and unc-3(e151) animals. N >30 for krEx1068 in WT and unc-3(e151) animals. Left side view of the head is shown. Anterior is to the left. madd-4L is also expressed in head ganglia, which appear out of focus to the right of each image.
B: The expression of madd-4L transcriptional reporters is significantly affected in the SAB neurons of unc-3(e151) mutants. Results for three independent extrachromosomal arrays (otEx4946, otEx5410, sEx14990) are quantified on the right. Scale bar 10 µm. N >30 for otEx4946, otEx5410, and sEx14990 in WT and unc-3(e151) animals.
C: The protein expression of MADD-4B is significantly affected in the SAB neurons of unc-3(e151) mutants. Results for two independent extra-chromosomal arrays (kr1069 and kr1070 are MADD-4B translational fusions) are quantified on the right. Scale bar 10 µm. N > 33 for krEx1069 and krEx1070 in WT and unc-3(e151) animals. MADD-4B is also expressed in head ganglia, which appear out of focus to the right of the image.
D: The expression of MADD-4B transcriptional reporters is significantly affected in unc-3(e151) mutants. Results for three independent extra-chromosomal arrays (otEx5601, otEx5602, otEx5603) are quantified on the right. Scale bar 10 µm. N > 30 for otEx5601, otEx5602 and otEx5603 in WT and unc-3(e151) animals.
E: Schematic representation of the madd-4 locus. The location of the kr249 molecular lesion (W374stop) is indicated with a red triangle.
F: Mutational analysis of the cis-regulatory region of madd-4. Multiple transgenic lines were analyzed for each construct. See Table S2 for detailed quantification (number of animals and number of transgenic lines) of the promoter analysis data. Lines indicate genomic region fused to gfp (green). (+) indicates robust expression in the SAB neurons, or ventral nerve cord MNs, or head (at least 80% of the animals) in at least 2 independent transgenic lines. (+/−) indicates significant reduction in the number of neurons expressing the reporter gene or in the fluorescent intensity of the reporter gene in at least 50% of the animals (in at least 2 independent transgenic lines) when compared to transgenic animals carrying longer genomic fragments of the cis-regulatory region. (−) indicates complete loss of reporter gene expression in the SAB neurons, or ventral nerve cord MNs, or head in at least 90% of the animals (in at least 2 independent transgenic lines) when compared to transgenic animals carrying longer genomic fragments of the cis-regulatory region. (*) indicates that the COE motif (vertical light blue line) is conserved in at least 3 other nematode species. MUT indicates that COE motif has been mutated by always substituting the same 2 nucleotides in the core sequence (for example, wild-type COE site: TCCCNNGGGA >> COE MUT site: TGGCNNGGGA). Animals at the fourth larval (L4) stage were analyzed. The madd-4B-transcriptional reporter of 4366 bp cis-regulatory region does not contain the first exon of madd-4B.

