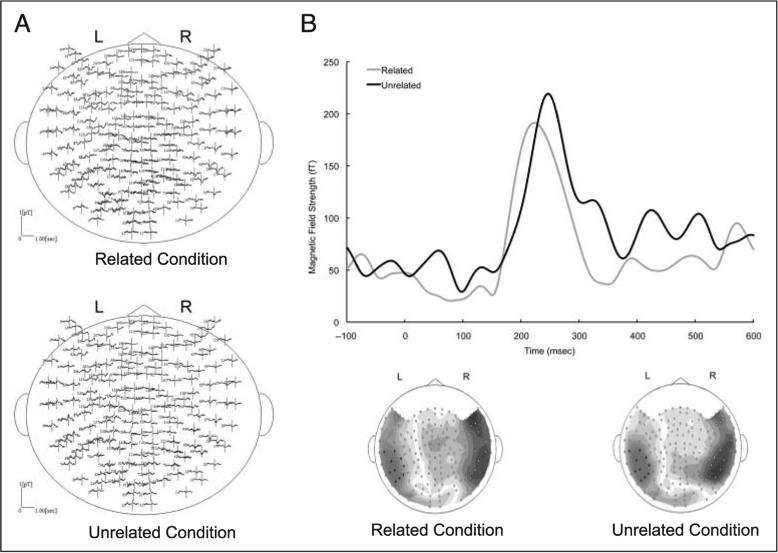
Figure 2.
(A) The MEG responses (−300–700 msec) in all channels for the transparent conditions (top, related condition; bottom, unrelated condition). Data are from a representative subject. (B) RMS waveform of the robust peak identified after the onset of the target. Time 0 indicates the onset of the target.

