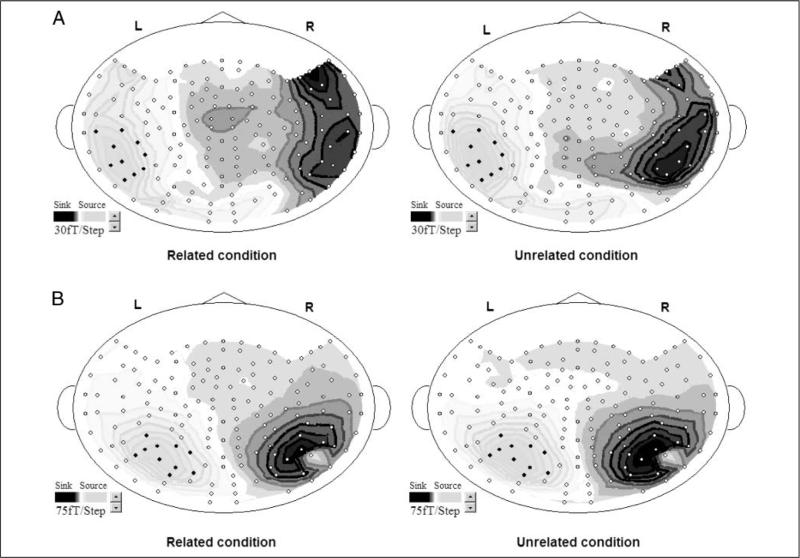
Figure 3.
The magnetic field distribution of the component peaking, on average, at 220 msec for the related and unrelated transparent conditions for two representative participants (A and B). Dark gray indicates an outgoing magnetic field (sink), whereas light gray indicates an incoming magnetic field (source); note that the visible source and the visible sink are not generated from the same dipole as they are in different hemispheres.

