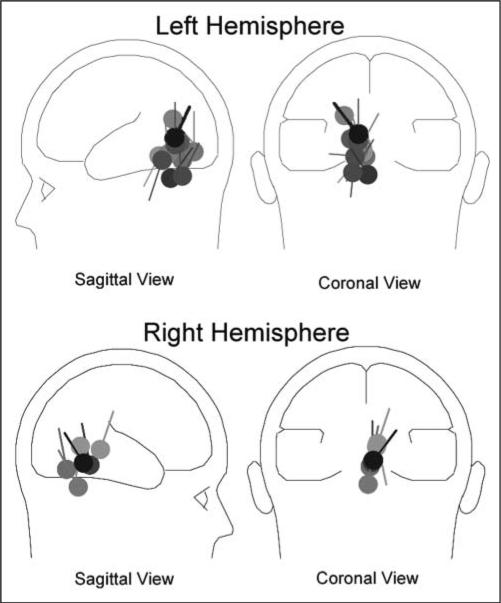
Figure 5.
ECD source locations and dipole orientations for the component peaking at approximately 220 msec across all experimental conditions. The location of the dipoles resembles that typical of the M170 (e.g., Harris et al., 2008; Pylkkänen et al., 2006). Moreover, although there is greater variability in the orientations of the dipoles in our source models, the spatial locations across participants appear to be more consistent here than reported by Harris et al. (2008). The black dipole represents the grand average location and orientation calculated over participants for each hemisphere, whereas the gray dipole markers represent fits for individual participants.

