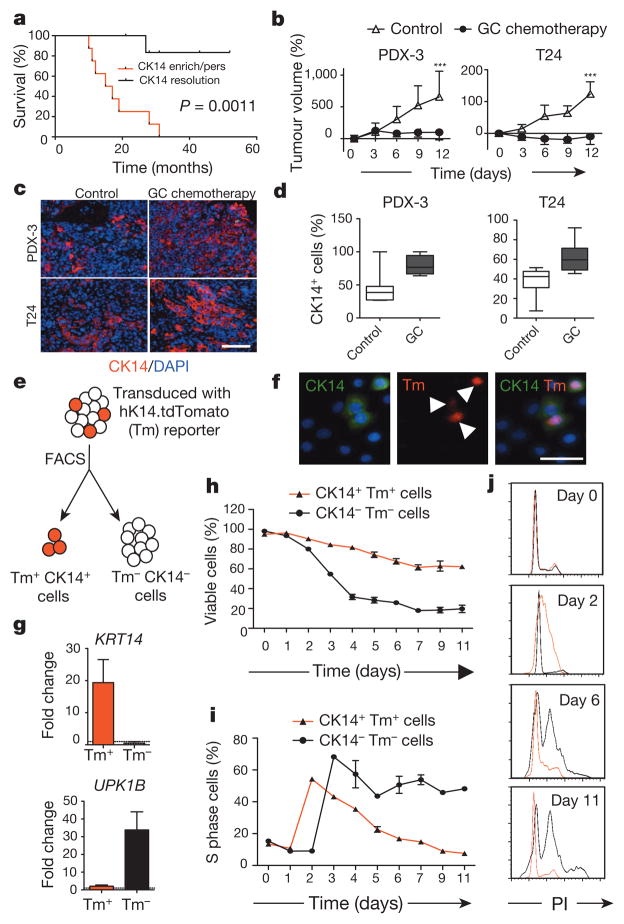
Figure 1. Cytotoxic chemotherapy induces CK14+cancer cell proliferation despite reducing tumour size.
a, Kaplan–Meier analysis of bladder-cancer patients with various CK14 staining patterns (enrich/pers denotes an enrichment (increase) or persistence of CK14 staining; resolution denotes an absence) after neoadjuvant chemotherapy (n = 15). b, Relative change in xenograft tumour size after chemotherapy (n = 6 xenograft tumours per group). PDX-3, patient-derived xenograft from patient 3; T24, human bladder cancer cell line-derived xenograft. c, d, Representative immunofluorescence staining (c) and box plots quantifying the percentage of CK14+ bladder cancer cells after chemotherapy (d). DAPI, 4′,6-diamidino-2-phenylindole. e, Schematic demonstrating the transduction of hK14.tdTomato lentiviral reporter into urothelial carcinoma cells. f, Immunofluorescence staining verifying the specific expression of tdTomato (Tm)-positive signal in CK14+ cancer cells. g, Quantitative PCR (qPCR) analysis of KRT14 and UPK1B in cancer cell subpopulations in biological duplicates. h, i, Graphs summarizing viability (h) and corresponding percentage of S phase cells (i) in two cancer subpopulations after chemotherapy in biological duplicates. j, Cell cycle profiles for Tm+ CK14+ (red line) and Tm− CK14− (black line) cancer cells at indicated days after chemotherapy. PI, propidium iodide. Data in b represent mean ± s.e.m.; box plots in c show twenty-fifth to seventy-fifth percentiles, with line indicating the median, and whiskers indicating the smallest and largest values; data in g–i show mean and range. ***P <0.001 (log-rank test (a) and two-tailed Student’s t-test (b)). Scale bars, 100 μm.

