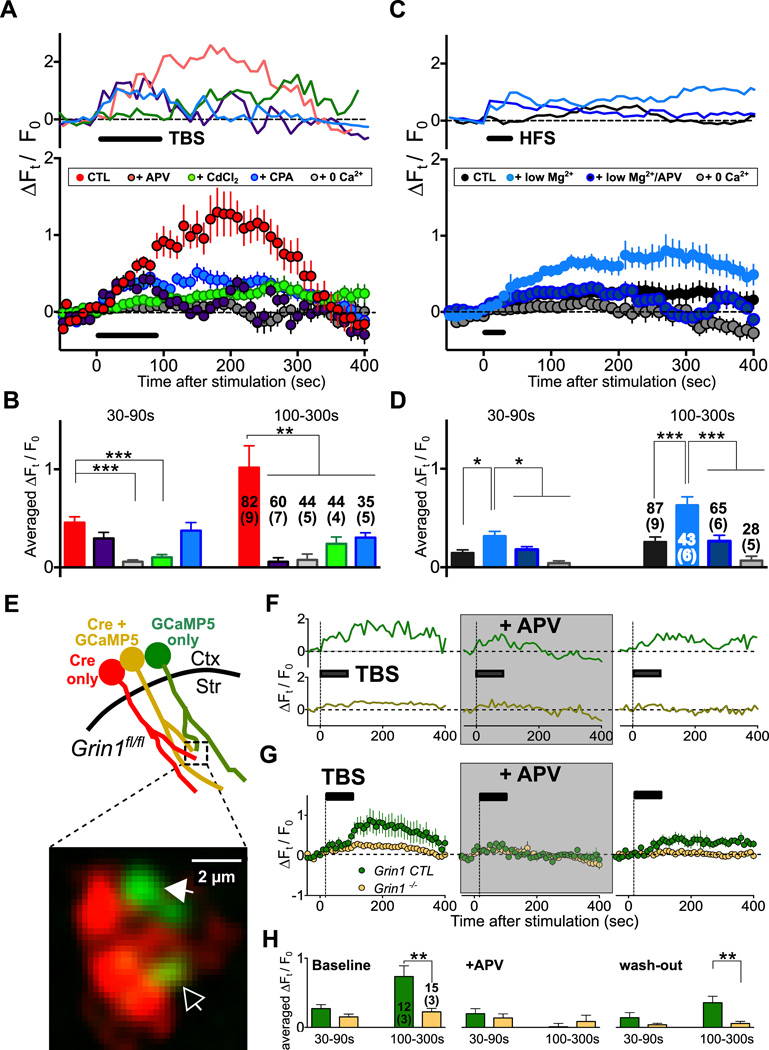
Figure 3. TBS-induced Ca2+ Elevation in Cortical Axons Depends on Axonal NMDARs.
(A) Measurements of GCaMP5 fluorescence signals from cortical axon terminals in the dorsal striatum. Upper traces: Sample recordings of TBS-induced GCaMP5 fluorescence from a representative experiment. Different experimental conditions are coded by colors (same as the graph below). The graph depicts the results from all experiments on TBS-induced fractional changes in GCaMP5 fluorescence with time (ΔFt / F0). Mean ± s.e.m. (n= 44 – 82 at least from 4 slices) “CTL” (control): ACSF (with 2 mM Mg2+ and 100 µM picrotoxin). “+APV”: ACSF with 100 µM APV. “CdCl2”: ACSF with 100 µM CdCl2. “+CPA”: normal ACSF with 30 µM CPA. “0 Ca2+”: ACSF with no added Ca2+ and 2 mM EGTA.
(B) Summary of average ΔFt/F0 (± s.e.m.) during 30 – 90s and 100 – 300s after TBS application. Colors on the bar are same with (A). Numbers of puncta and slices (with bracket) are shown with the bars (**, p < 0.01; ***, p < 0.001; one-way ANOVA with post-hoc test). Averaged ΔFt/F0 during 30 – 90s: CTL, 0.45 ± 0.06; APV, 0.30 ± 0.06; CdCl2, 0.10 ± 0.03; CPA, 0.30 ± 0.05; 0 Ca2+, 0.06 ± 0.02. Averaged ΔFt/F0 during 100 – 300s: CTL, 1.02 ± 0.22; APV, −0.05 ± 0.04; CdCl2, 0.24 ± 0.07; CPA, 0.37 ± 0.08; 0 Ca2+, 0.08 ± 0.06.
(C) Measurements of GCaMP5 fluorescence signals from cortical axon terminals in the dorsal striatum. Upper traces: Sample recordings of HFS-induced GCaMP5 fluorescence from a representative experiment. Different experimental conditions are coded by colors (same as the graph below). The graph depicts results from all experiments on HFS-induced fractional changes in GCaMP5 fluorescence with time (ΔFt / F0). Mean ± s.e.m. (n= 28 – 87 at least from 5 slices). “CTL”: ACSF (with 100 µM picrotoxin, 2 mM Mg2+). “low Mg2+”: low-Mg2+ ACSF (< 200 µM Mg2+ ). “low Mg2+/+APV”:low-Mg2+ ACSF with 100 µM APV. “0 Ca2+”: ACSF with no added Ca2+ and 2 mM EGTA.
(D) Summary of the average ΔFt/F0 (± s.e.m.) during 30 – 90s and 100 – 300s after HFS application. Color codes are same as in (C). Numbers of puncta and slices (with bracket) are shown with the bars (*, p < 0.05; ***, p < 0.01; one-way ANOVA with post-hoc test). For 30 −90s: CTL, 0.14 ± 0.03; low-Mg2+, 0.31 ± 0.04; low-Mg2+/+APV, 0.18 ± 0.03; 0 Ca2+, 0.04 ± 0.02. For 100 – 300s: CTL, 0.25 ± 0.05; low-Mg2+, 0.63 ± 0.09; low-Mg2+/+APV, 0.26 ± 0.06; 0 Ca2+, 0.07 ± 0.05.
(E) Schematic diagram showing striatal slices of Grin1fl/fl mice expressing Cre-2a–mCherry and GCaMP5 in M1-derived axons. Red: Cre (mCherry) only. Green: GCaMP5 only. Yellow: Cre + GCaMP5. The fluorescence image below at a higher resolution shows a representative dorsal striatal area containing these three types of axons. Empty arrowhead: axon expressing Cre + GCaMP5. Filled arrowhead: axon expressing only GCaMP5.
(F) Representative recording traces of GCaMP5 fluorescence changes with time (ΔFt / F0) recorded from the GCaMP5-only axon (green), and axon co-expressing GCaMP5 and Cre (yellow) during three episodes of TBS (bar), prior to and after APV was added, as well as after APV was washed out. No GCaMP5 signal was detected from axons expressing only Cre.
(G) Summary of all data (mean ± s.e.m; n= 12 – 15) recorded in a similar manner as shown in (f), for axons expressing only GCaMP5 (“ Grin1-CTL”) and axons expressing both GCaMP5 and Cre (“Grin1−/−”) in 3 striatal slices.
(H) Summary of average ΔFt/F0 (± s.e.m.) during 30 – 90s and 100 – 300s after TBS application. Color codes are same with (F) and (G). Numbers of puncta and slices (with bracket) from two mice are shown with the bars (**, p < 0.01; unpaired t-test). In the control condition (baseline), averaged ΔFt/F0 during 30 – 90s: Grin1 CTL= 0.27 ± 0.06; Grin1 −/− = 0.15 ± 0.04, averaged ΔFt/F0 during 100 – 300s: Grin1 CTL= 0.74 ± 0.15; Grin1 −/− = 0.22 ± 0.05. In the presence of APV (+APV), averaged ΔFt/F0 during 30 – 90s: Grin1 CTL= 0.20 ± 0.07; Grin1 −/− = 0.14 ± 0.06, averaged ΔFt/F0 during 100 – 300s: Grin1 CTL= 0.01 ± 0.05; Grin1 −/− = 0.09 ± 0.09. After APV was washed out (wash-out), averaged ΔFt/F0 during 30 – 90s: Grin1 CTL= 0.14 ± 0.07; Grin1 −/− = 0.04 ± 0.02, averaged ΔFt/F0 during 100 – 300s: Grin1 CTL= 0.35 ± 0.09; Grin1 −/− = 0.05 ± 0.03. See also Figure S3.

