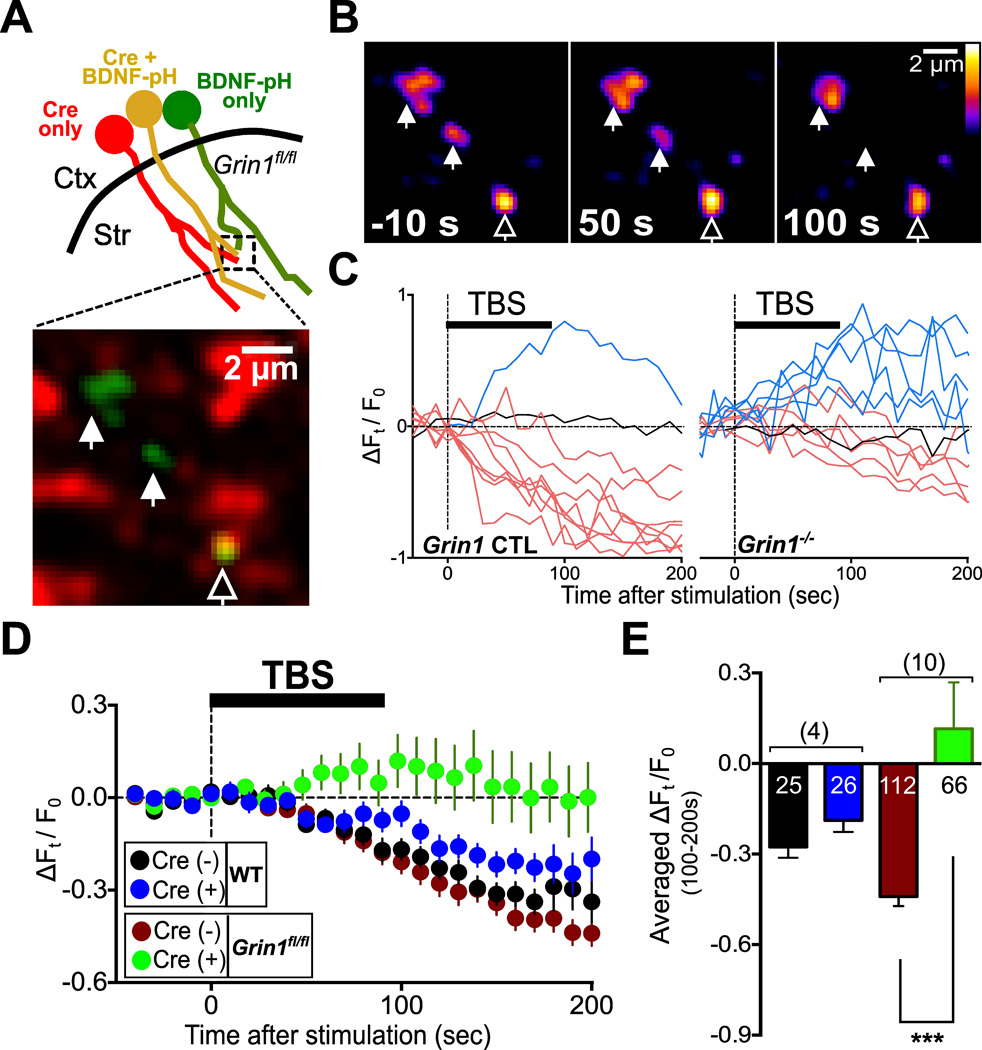
Figure 5. TBS-induce BDNF Secretion Depends on Functional Axonal NMDARs.
(A) Upper: Schematic diagram shows striatal slices of Grin1fl/fl mice expressing either Cre-2a–mCherry (red) or BDNF-pH (green) alone, or both (yellow) in M1 axons. Below: Fluorescence image showing a dorsal striatal area containing puncta of the above three axon types. Filled arrowheads: axons expressing only BDNF-pH. Empty arrowhead: an axon co-expressing BDNF-pH and Cre.
(B) Fluorescence images of the example puncta in (A) at 10 s before and 50 and 100 s after the onset of TBS. Arrowheads are same with (A).
(C) Sample traces of BDNF-pH puncta fluorescence before and after TBS, recorded from axons expressing BDNF-pH only (Grin1 CTL) and co-expressing BDNF-pH and Cre (Grin1−/−), respectively. Color codes are the same as in Figure 4E.
(D) Average fractional fluorescence changes with time (ΔFt/F0) for BDNF-pH puncta of Cre (−) or Cre (+) axons in wild-type WT or Grin1fl/fl mice. (E) Bar graphs represent average ΔFt/F0 (± s.e.m.) during 100 – 200 s after HFS or TBS application for all recorded BDNF-pH puncta. Numbers of puncta and slices (with bracket) are shown with the bars. In WT: Cre (−), −0.28 ± 0.04; Cre (+), − 0.19 ± 0.04. In Grin1fl/fl Cre (−), − 0.28 ± 0.04; Cre (+), 0.02 ± 0.11; ***, p < 0.0001, unpaired t-test. See also Figure S5.

