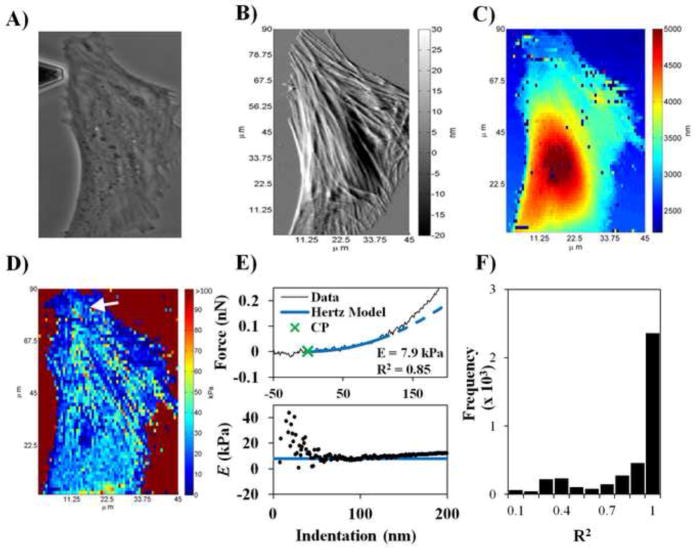
Fig. 4.
Demonstration of force mapping with CPD algorithm. (A) A 40x phase image of selected CICAC cell. (B) AFM deflection image of cell. (C) 64 x 64 calculated height map of the cell from the CPD algorithm. Force curves with significant baseline fluctuations were not considered for analysis and identified by basic error handling in the code. For these curves, the height and E were set to zero and do not represent the actual cell height and stiffness, respectively. (D) 64 x 64 E map of the cell from the CPD algorithm. (E) Representative force curve (from arrow position in E map), Hertz model fit and corresponding E vs indentation plot. The dashed line is an extrapolation of the Hertz model beyond the indentation range selected by the CPD algorithm. The solid line in the E vs indentation plot is E value determined by the CPD algorithm. (F) Histogram of R2 values for Hertz model fits of the entire force map. The vertical axis represents the number of occurances.

