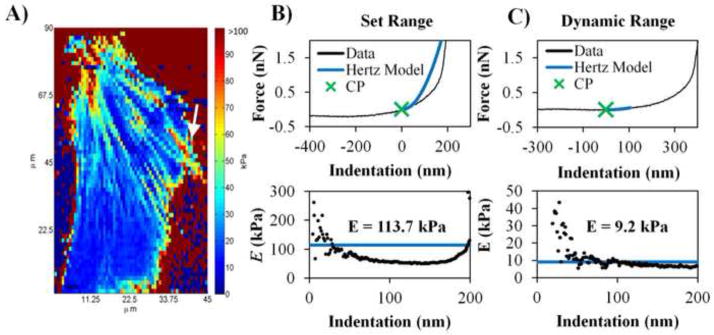
Fig. 5.

Comparison of indentation ranges used in CPD algorithm. (A) Same force map data from Figure 3D but analyzed with the CPD algorithm using the entire indentation length of collected data (set indentation range). Regions of E = 0 kPa on glass substrate regions are a result of error handling processes in the code (i.e. E is set to 0 kPa when there is an abnormal force curve). (B) A sample force curve from force map in (A; indicated by white arrow) and CP selection based on a set indentation range along with the corresponding E vs indentation plot. (C) Same location of selected force as (B) but CP selection was based on the dynamic indentation range specified in the CPD algorithm and the corresponding E vs indentation plot.
