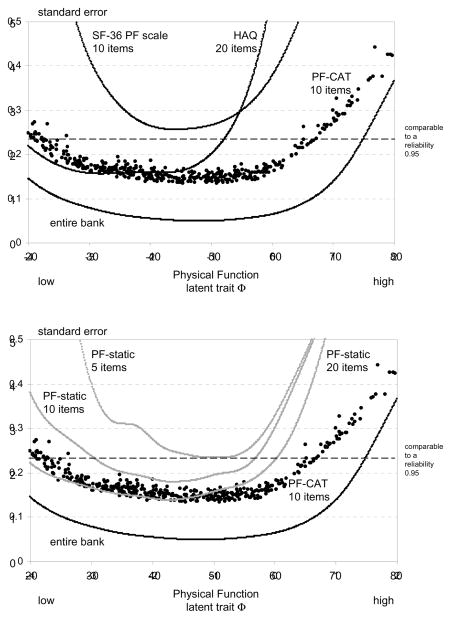
Figure 1. Measurement precision and range of two established static tools, PROMIS static forms, a simulated PROMIS PF-CAT with 10 items, and the entire item bank.
The Y-axis shows the standard error of measurement, the X-axis the Θ-value. The graph shows the precision of the test which can be expected at a particular level of Physical Function (latent trait, Θ) based on test information (static forms) or simulation studies (CAT)

