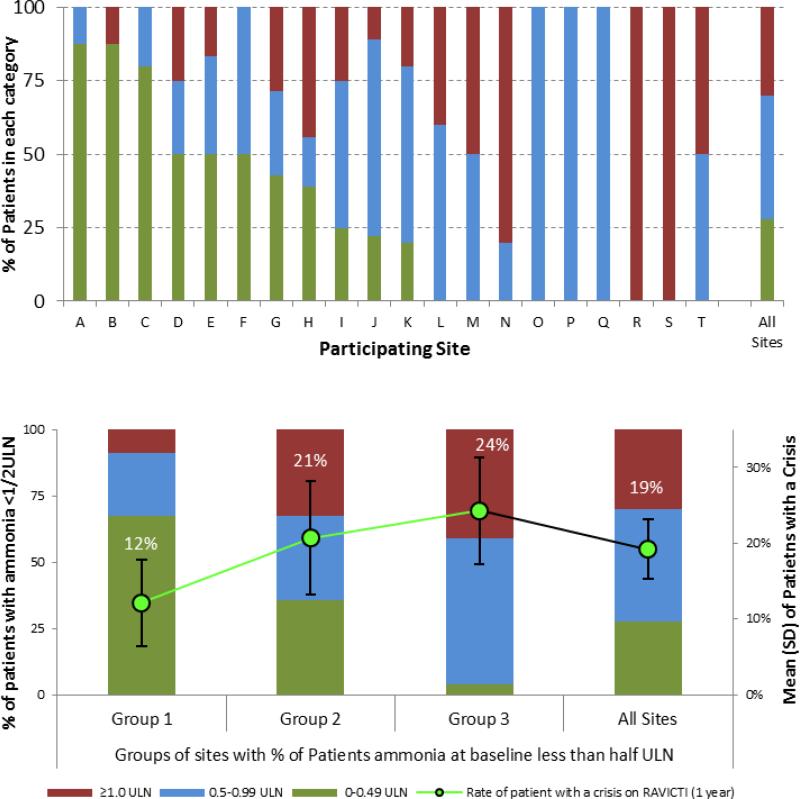
Figure 3.
Ammonia levels and HAC rate by study site. Top Panel: Percentage of patients at each study site with baseline ammonia <0.5 ULN, 0.5 – 1 ULN, and ≥ 1.0 ULN. Bottom Panel: Percentage of patients in each ammonia ULN category by sites grouped in relation to ammonia levels among patients enrolled at the site. Group 1 (6 study sites; 33 patients, of whom >50% had baseline ammonia levels < 0.5 ULN); Group 2 (3 study sites; 29 patients, of whom 25%-50% had baseline ammonia levels < 0.5 ULN); and Group 3 (11 sites; 38 patients, of whom < 25% had baseline ammonia < 0.5 ULN)

