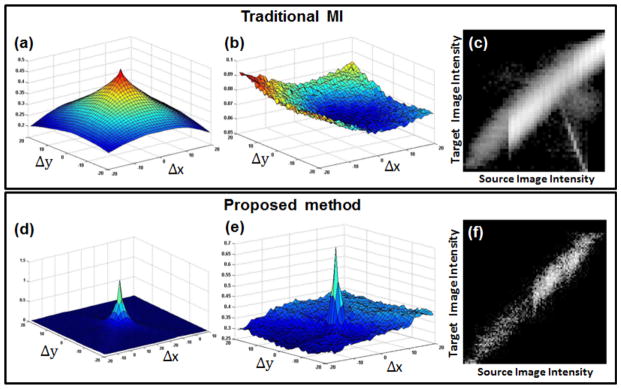
Fig. 6.

Comparison between MI (top row) and proposed method (bottom row) on synthetic datasets. (a) and (d) represent the cost value plots between Figs. 5(a) and 5(b) as a function of horizontal and vertical shifts. (b) and (e) show the cost value plots between Figs. 5(c) and 5(d). (e) and (f) show the joint histograms plotted after performing registration with initial misalignments of 5 and 5 pixels in x and y axes.
