
Figure 3.
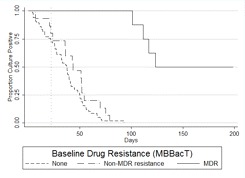
A, Kaplan-Meier survival estimate of time to culture conversion comparing resistance levels with baseline drug susceptibility tests (DSTs) by MBBacT. Log-rank test for equality of survivor function comparing non-multidrug-resistant (non-MDR) tuberculosis (TB) versus fully drug-susceptible TB (P = nonsignificant). Vertical line at 22 days indicates the median time to DST results using the MBBacT test after primary isolation by MBBacT. B, Kaplan-Meier survival estimate of time to culture conversion comparing resistance levels with baseline DSTs by proportion test. Log-rank test for equality of survivor function comparing non-MDR TB versus fully drug-susceptible TB (P = .029). Vertical line at 68 days indicates the mean time to DST results using the proportion test after primary isolation in Lowenstein-Jensen culture. C, Kaplan-Meier survival estimate of time to culture conversion comparing resistance levels with baseline DSTs by microscopic observation drug susceptibility (MODS). Log-rank test for equality of survivor function comparing non-MDR TB versus fully drug-susceptible TB (P = .010). Vertical line at 7 days indicates the median time to DST results using the MODS assay.