
Figure 4.
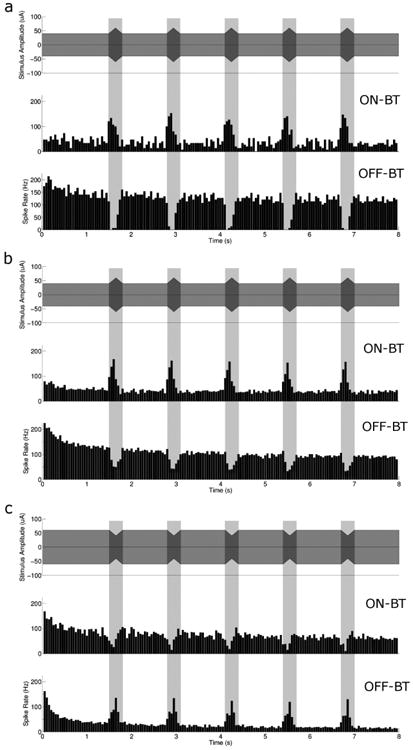
Non-zero baseline amplitude modulated 2000 PPS stimulus produces differential responses in ON vs. OFF-BT cells. (a) (top) Schematic representation of a 2000 PPS modulating envelope with a baseline level of 40 μA and peak amplitude of 60 μA. Response histograms are shown for a single ON-BT (middle) and OFF-BT cell (bottom) (b) Population results for a modulating envelope with a baseline of 40 μA and a peak of 60 μA (top), for ON-BT (middle) and OFF-BT (bottom) responses. (c) Population results for a modulating envelope with a baseline of 60 μA and a peak (decrease) of 40 μA (top), for ON-BT and OFF-BT responses. All histograms have a bin size of 50 ms.