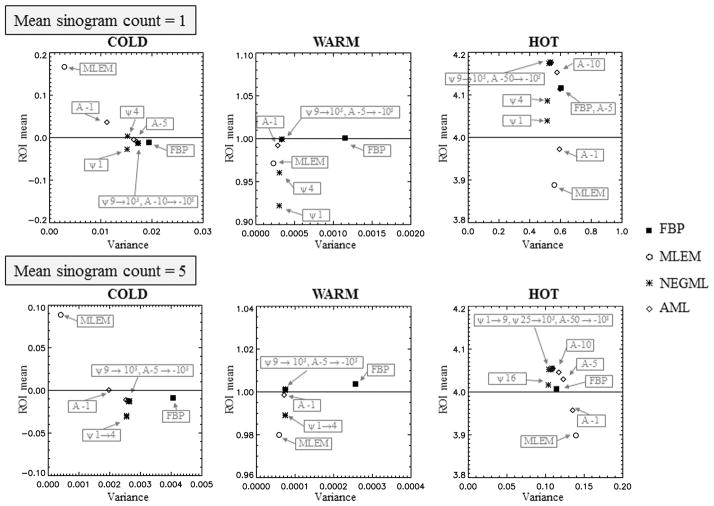
Fig. 8.
Phantom 1. Mean with respect to variance in the cold regions, warm region and hot region for different values of ψ and A. Chosen frame duration correspond to on average 1 and 5 counts per sinogram pixel. Solid line represent the true value for each region. Ordinary Poisson with randoms smoothing.

