
Figure 1.
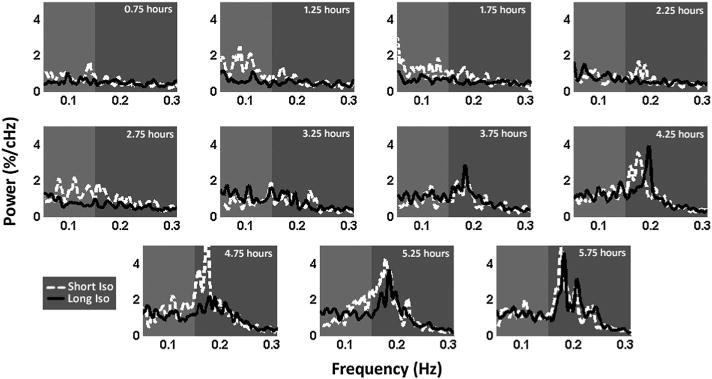
Power spectrum evolution. Plots of average power spectra from the short isoflurane (30 min) group (four rats – dotted white line) and long isoflurane (3 h) group (seven rats – solid black line) followed by resting state imaging at 30 min intervals under a fixed dosage of dexmedetomidine for 5.75 h. Power spectra are derived from a time course generated from the left S1 cortex. Low-band power (0.05–0.149 Hz; light grey) increases at the 1.25 h time point in the short isoflurane group and does not increase in the long isoflurane to a similar level until the 3.25 h time point, when near convergence of the two groups’ spectral signals occurs. At the 3.25 h time point, a strong ~0.18 Hz peak arises in both groups within the high-band data (0.15–0.3 Hz) and dominates the power spectra for the remainder of the functional scans. Both groups indicate a clear evolution of spectral information as time under dexmedetomidine (and time since isoflurane cessation) increases.