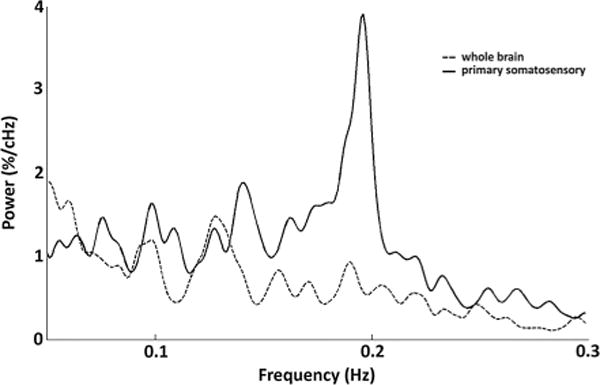
Figure 2.

Primary somatosensory cortex and whole brain spectra. The average group power spectra from the long isoflurane data at the 4.25 h time point are plotted for the both the S1 signal (solid line) and the global signal (dotted line). A strong peak at ~0.18 Hz dominates the low-frequency power spectrum of the S1 signal, but it is only minimally present in the whole brain spectra, indicating that this peak is a local phenomenon as opposed to a global one.
