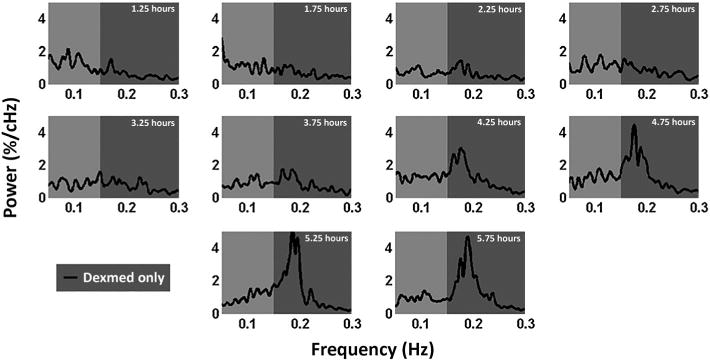
Figure 9.

Power spectra generated from a dexmedetomidine-only anesthetic paradigm. Five rats were injected with a bolus of dexmedetomidine while fully awake to induce the sedated state. Following sedation, standard dexmedetomidine infusion rates were used to maintain sedation. fMRI scans were collected at 30 min intervals for 5.75 h. This figure shows averaged power spectra at each time point obtained from the S1 cortex. Low-band power (0.05–0.15 Hz) remains relatively consistent throughout the study, while a strong ~0.18 Hz peak emerges around the 3.75 h time point and dominates the signal by the 4.25 h time point.
