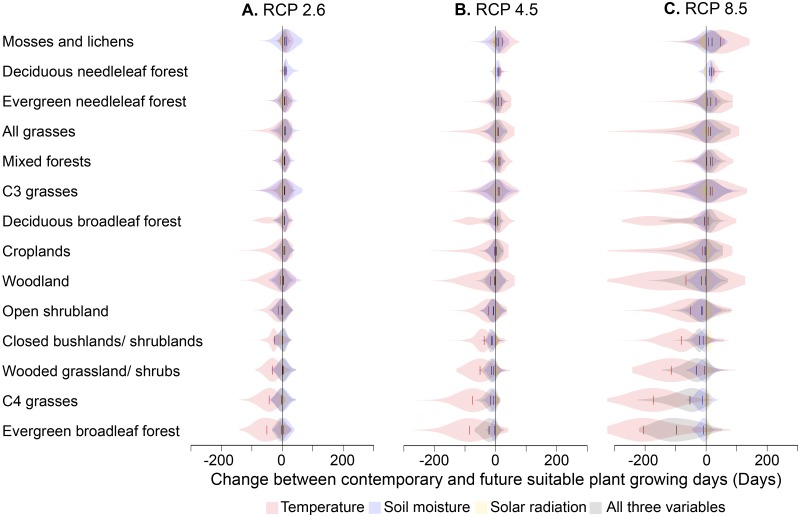
Fig 4. Biological exposure to projected changes in suitable plant growing days.
Violin plots show frequency distributions of projected change between future and contemporary suitable plant growing days for all areas covered by each ecosystem; vertical colored lines indicate global median change for the given ecosystems. These plots are simply the overlay of our plant suitable days (data are provided in S2 Data) for areas of different land uses: (http://webmap.ornl.gov/wcsdown/wcsdown.jsp?dg_id=10006_1, http://webmap.ornl.gov/wcsdown/wcsdown.jsp?dg_id=20042_6, and http://webmap.ornl.gov/wcsdown/wcsdown.jsp?dg_id=20042_8).

