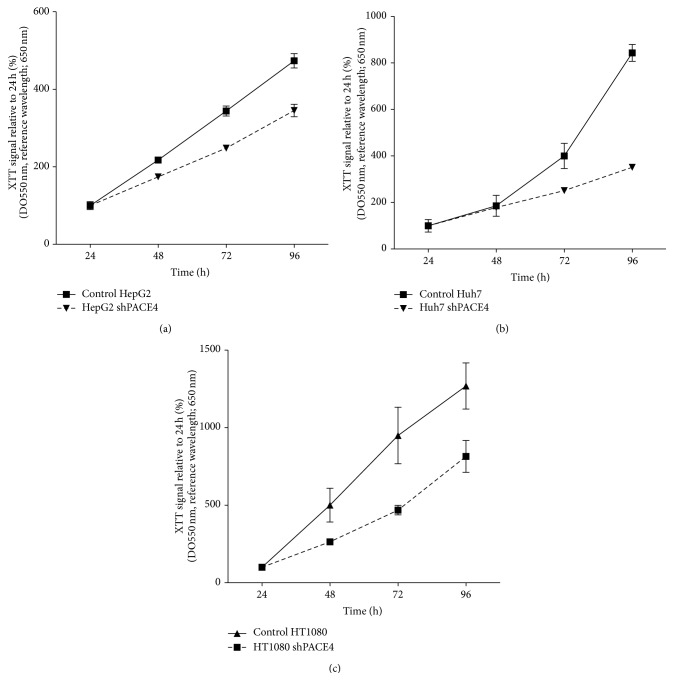
Figure 2.
Knockdown cell proliferation rates. Percentage of initial (24 h postseeding) metabolic activity determined on mirror plates every 24 h using XTT reagent for HepG2 (a), Huh7 (b), and HT1080 (c). Control cells are shown as plain line and knockdown cells as dashed lines. Data are means ± SEM of at least 3 independent experiments.

