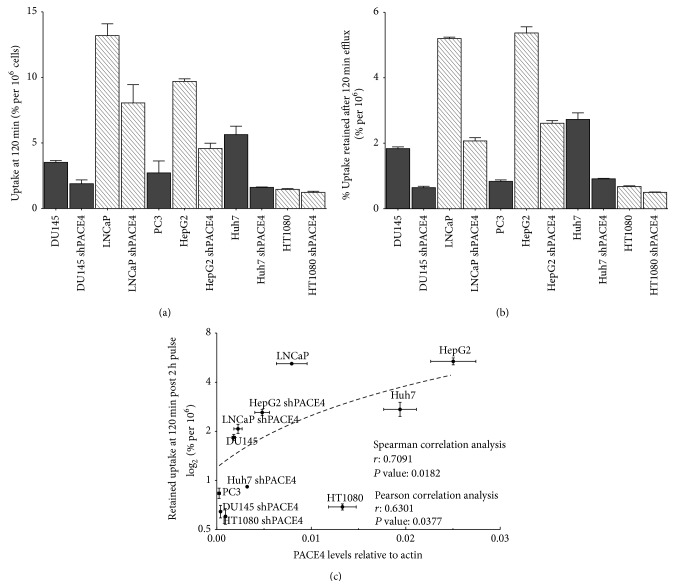
Figure 4.
64Cu/NOTA-ML uptake and retention correlation with PACE4 levels in cells. (a) Percentage of uptake after 2-hour pulse and (b) percentage of retained radioactivity 2 h after the 2-hour pulse per 1 × 10⁶ cells. (c) Plot of PACE4 expression levels as a function of the log2 of the mean percentage of retained radioactivity after 2-hour efflux. Log2 is applied only to scatter points to make it more visible. Name of the cell line is indicated above each corresponding point. Dashed line represents a linear regression for visual purposes.

