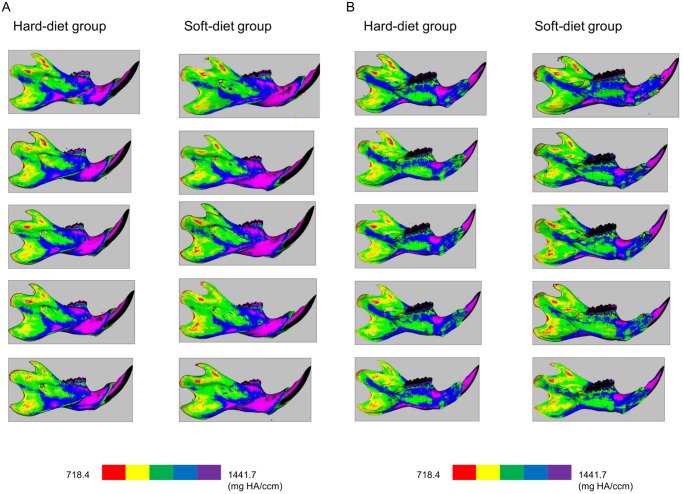
Fig 3. Lateral (3-A) and medial (3-B) views of the cortical mineralization.
Left column: bones of the hard-diet group, Right column: bones of the soft-diet group. The colours red, yellow, green, blue, and purple indicate mineralization ranges 718.4–863.0, 863.0–1007.7, 1007.7–1152.4, 1152.4–1297.0, and 1297.0–1441.7 mg HA/ccm, respectively.

